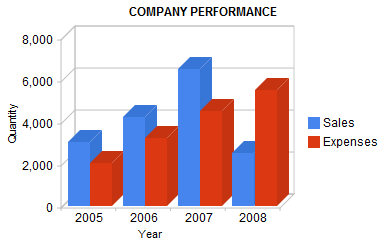
A column chart displays a series as a set of vertical bars that are grouped by category. Column charts are useful for showing data changes over a period of time or for illustrating comparisions among items. Column Chart Control is an interactive chart, try clicking on a column or on the legend entries.
The user control is really simple, you just need to set one property in order to get the control working. The Data property.
- Drag and drop Google Charts Control.
- Set Column Chart to property named Type.
- Assign to the Data property a variable based on GoogleChartData data type (this SDT is automatically imported when dropping the control to a web form).
- Load the information that will be shown by the chart using a variable based on GoogleChartData.
//Sample code for GoogleCharts
Sub 'LoadGoogleChartData'
    &GoogleChartData.Categories.Add("2005")
    &GoogleChartData.Categories.Add("2006")
    &GoogleChartData.Categories.Add("2007")
    &GoogleChartData.Categories.Add("2008")

    &GoogleChartSeries = new()
    &GoogleChartSeries.Name = "Sales"
    &GoogleChartSeries.Values.Add(3045)
    &GoogleChartSeries.Values.Add(4246)
    &GoogleChartSeries.Values.Add(6537)
    &GoogleChartSeries.Values.Add(2537)
    &GoogleChartData.Series.Add(&GoogleChartSeries)

    &GoogleChartSeries = new()
    &GoogleChartSeries.Name = "Expenses"
    &GoogleChartSeries.Values.Add(2045)
    &GoogleChartSeries.Values.Add(3246)
    &GoogleChartSeries.Values.Add(4537)
    &GoogleChartSeries.Values.Add(5537)
    &GoogleChartData.Series.Add(&GoogleChartSeries)
EndSub
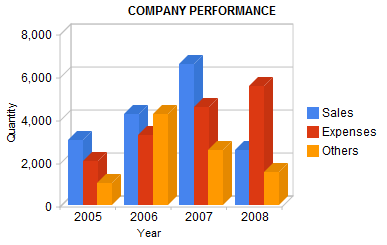
- Add a new series and its corresponding values to GeneXusColumnData variable (the variable assigned to control's ChartData property.
&GoogleChartSeries = new()
&GoogleChartSeries.Name = "Others"
&GoogleChartSeries.Values.Add(1045)
&GoogleChartSeries.Values.Add(4244)
&GoogleChartSeries.Values.Add(2537)
&GoogleChartSeries.Values.Add(1537)
&GoogleChartData.Series.Add(&GoogleChartSeries)
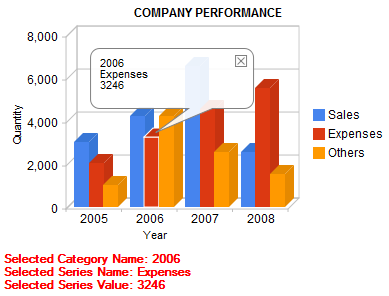
As we mentioned before, Column Chart Control is an interactive chart. That is, when clicking on series legend the corresponding columns will be highlighted. In addition, when clicking on a column, a tooltip will be displayed and also a GeneXus event wil be fired.
//GoogleChartsControl event handler
Event GoogleCharts1.Select
    msg(!"Selected Category Name: " + &GoogleChartSelectedData.CategoryName)
    msg(!"Selected Series Name: " + &GoogleChartSelectedData.SeriesName)
    msg(!"Selected Series Value: " + str(&GoogleChartSelectedData.SeriesValue))
EndEvent
Note: &GoogleChartSelectedData is based on GoogleChartSelectedData SDT (this SDT is also automatically imported when dropping the control to a web form.
Column Chart Control is based on the Google Column Chart Control.