The following issues may occur when Debugging or Profiling an application.
Warning: <Object Name> debuggable program. No debugger found at: <Computer Name>
or
Warning: <Object Name> under code coverage testing and no host found at: <Computer Name>
Description: Unable to connect to the remote server
Where Computer Name is where GeneXus is being executed.
- Cause: UAC (User Access Control) is enabled (Windows Vista or higher)
- Solution: Run GeneXus as administrator (right-button, 'Run as Administrator')
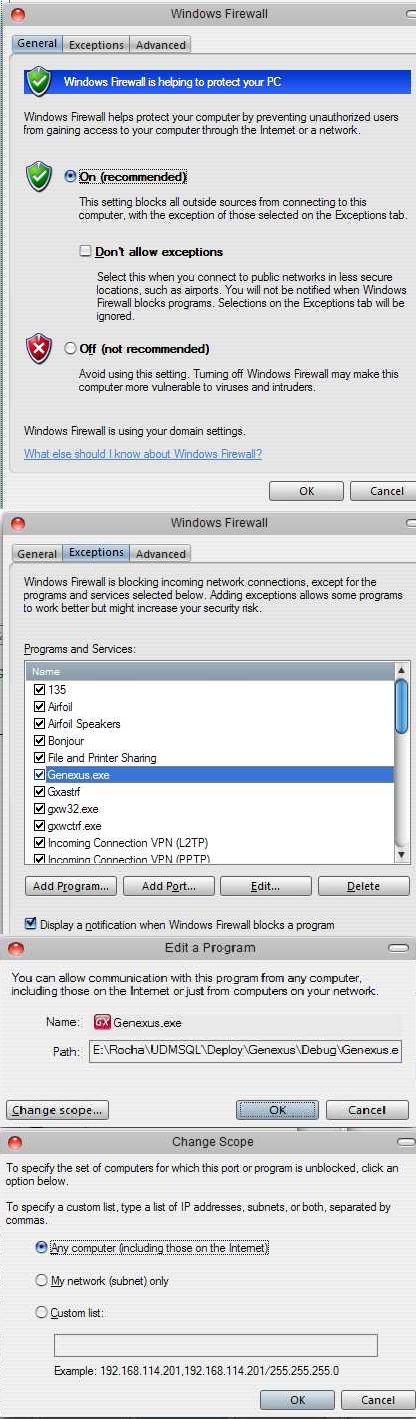
- Cause: The firewall is blocking the debugger.
- Solution: add GeneXus.exe as an exception in the Firewall. Follow the steps shown in the image below:
Follow the steps to test the connectivity between the debugger and the application.
1. Open GeneXus.
2. Open a command prompt console and run: telnet machinename 6776.
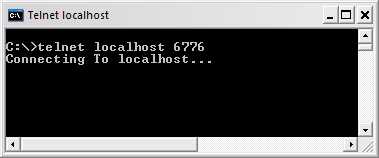
Note: 6776 is the default port number used by the debug tool window (DebuGx), but sometimes could be different. To know the real port number being used, open the source code of some debuggable program and search for Gxdebug.setPort (for Java) or Gxdebug.Port (for .NET).
2. Press <Enter>.
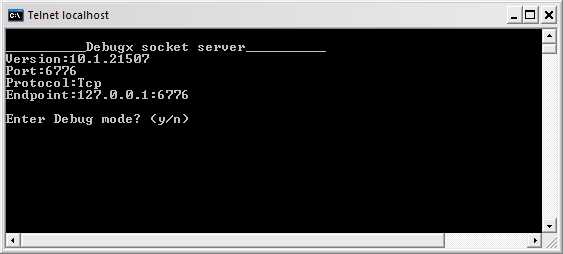
3. Press Y (or y).
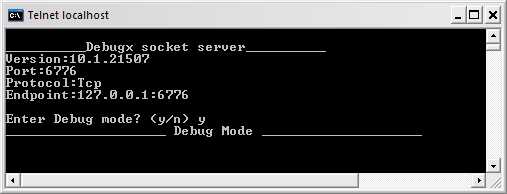
If you run the application in Debug mode, the console will show traffic between the application and GeneXus Debugger.