Objectives
-
Achieve a comprehensive view of process performance
-
Have tools available to measure business process efficiency
-
Identify potential bottlenecks
-
Evaluate the assignment method used
-
Answer questions such as:
-
What areas of the company are not efficient and why are response times too long?
-
Which are the processes that take longer to be completed and how can I optimize them?
-
Which tasks can be eliminated from the process because they don't add value?
-
How do participants perform on the various processes?
Process
-
A Data Warehouse is built with data gathered from process execution.
-
GXplorer is used to create the Data Warehouse.
-
GXplorer provides all the necessary features to make queries about process performance in the DW.
-
GXflow provides all the necessary elements to configure the DW.
Data Warehouse information is analyzed on the basis of:
-
Measures: Values that allow you to measure business outcomes (The “what” of questions). In general, they are the results of management events. Examples: Sales, Balances, Number of accounts that haven’t made the minimum payment, etc.
-
Quantity: It gives the number of steps taken by the various participants according to the selected dimensions. For example, if “process” is selected as analysis dimension, the number of times that this process has been executed can be seen.
-
Duration in Days: Duration of the various process steps measured in days.
-
Number of Alerts: It measures the number of process steps that triggered a time alert.
-
Number of Deadlines: It measures the number of process steps that were finished because the time available ran out.
-
Dimensions: Analysis perspectives of measures (“By” in questions). They are the actors that take part in management events. Examples: Year, Client Category, Field, etc.
-
All measures can be analyzed by all dimensions.
-
Lines of Analysis: Set of dimensions which are more or less independent from the events that take place.
Examples:
Time line – Year, Month, Day
Client – Client, Category, City, Region, Country
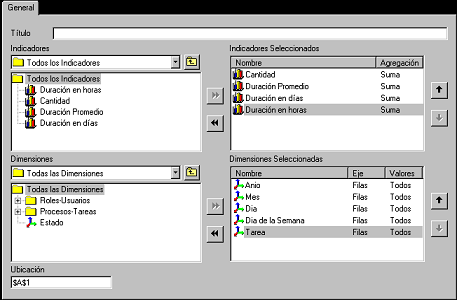
Queries to the DW are made by crossing Measures and Dimensions and applying filters. For example: “Number of tasks executed by Juan Perez, in the Purchase Process this year”.
Dimensions: Process, Task, Year and User.
Measures: Quantity.
In addition, adequate filters are applied: Process = “Purchases”, Task = “All”, Year = 2007 and User= “Juan Perez”
Queries are made in Excel using the GXplorer Olap component.
Steps to follow:
-
Download metadata from here.
-
Import the metadata in GXplorer 6.0 U4 or higher.
-
Create a datasource to the prduction data base.
-
Load the data warehouse using the DWfload object that is distributed with the GXflow Client.
Example:
Open the web browser and type an address like this:
Java: http://<server>:<port>/<webapp>/servlet/com.gxflow.dwfload
NET: http://<server>:<port>/<virtual directory application>/dwfload.aspx
Note: The metadata contains measures and dimensions in english language but you can change it from GXplorer Manager. There are some query examples.
See Also
GXflow Statistics (X Evolution 2)
GXflow provides all the necessary elements to configure the DW.