To do so, change the property Enable JDBC Log to True, and enter a path and/or name for the log.
NOTE: If GeneXus is not available, you can edit client.cfg (or server.cfg when using 3-tier Windows) and change the following keys:
- JDBC_LOG= e:\logs\jdbc.log
- JDBCLogEnabled=1
- JDBCUniqueName=0
- JDBCLogBuffer=0
- JDBCLogDetail=0
Copy gxclassD.zip as gxclassD.jar to the webapp lib where the application is running. Delete (or change the extension of) gxclassR.jar of that dir.
>> WEB Application
1) Copy gxclassD.zip as gxclassD.jar to the webapp lib where the application is running. Delete (or change the extension of) gxclassR.jar of that dir.
2) Set the property Enable JDBC Log to True and indicate a path and/or name for the log.
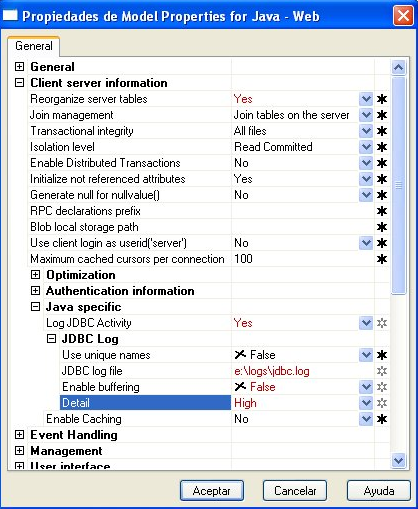
Change the following properties in the Log JDBC Activity group of the generator.
- "Use unique names" = true
- "Path for log files": indicate a path that can be accessed from the application server where the logs will be saved.
- "Log Level" = Connection. ?As since GeneXus Salto, its name is "JDBC Log Level".
This option makes it easier to read the execution path of an application. For example, when trying to find an error caused by database locking. All connections are mixed in a single log, which makes it harder to follow the thread and ignore, for instance, connections that are not relevant to the problem.
Log names are written in this way: "gx_" + MMDD + "_" + HHMMSS + <namespace> + "_" + <datastore> + "_" + <connection> + ".log" where
MMDD - Month Day
HHMMSS - Hour Minutes Seconds
namespace - Application package name
datastore - Data store to which the connection is being made
connection - Connection ID
Example: gx_0129_100352_com.testlogjdbc_DEFAULT_24306159.log
In the log header, this data is displayed as shown below:
Generator version : 9.0.4.074
If it doesn't have a pool, each line is marked with (-1). For a 3-tier web or win application that uses a connection pool, the details of the pool configuration are displayed in the first line below the header. In addition, in each line, the handle number of the user currently using that connection is shown between '()'.
Example: log WITHOUT pool
       0(-1)(17:08:38.453)GXConnection/4687246: Trying to connect to : Driver  : net.sourceforge.jtds.jdbc.Driver
       1(-1)(17:08:38.468)GXConnection/4687246:                        URL     : jdbc:jtds:sqlserver://ursu-nb2:1433/test
       2(-1)(17:08:38.468)GXConnection/4687246:                        User    : ubartram
Example: log WITH pool
When the datastore property "Enable connection pooling" is set to True, the following line is generated in the log:
       0(0)(14:35:00.218)# null: Creating read-write pool size: 10, unlimited: true, recycle true, recycle type by creation time, recycle time 1800000
       1(794874206)(14:35:00.234)GXConnection/24072801: Trying to connect to : Driver  : net.sourceforge.jtds.jdbc.Driver
       2(794874206)(14:35:00.234)GXConnection/24072801:                        URL     : jdbc:jtds:sqlserver://ursu-nb2:1433/test
       3(794874206)(14:35:00.234)GXConnection/24072801:                        User    : ubartram
In this case, it shows that the pool is configured with the default values:
- size:10 -> it corresponds to the Size property when the Unlimited Size property is set to False.
- unlimited:true -> it corresponds to the Unlimited Size property when it is set to True.
- recycle true -> Recycle pool connections = True
- recycle type by creation time -> Recyle Type = By creation time
- recycle time 1800000 - > Recycle time (minutes) = 30
(794874206) is the handle number of the user using that connection.
In the line below, a connection is being assigned to the handle (user):
R/W Pool: Assigning connection to handle Cursors : 0 | Users: 1 | Uncommitted false | Assignment true
It indicates the values of the internal variables used to determine if the connection is available. They are as follows:
- Cursors must be set to 0 in order to be assigned to a new user,
- Uncommitted indicates if there are uncommitted operations that must be set to false in order to be assigned to a user.
- Users is the number of users using the connection. It made more sense when the pool RO was available because more than one user could use the connection; now, only one user at a time can use it, and that's why it is no longer so useful.
Note: As since GeneXus Salto, this information is omitted.
- Assignment is an internal variable indicating if the connection is being assigned at this moment.
Note: the information provided in these variables is irrelevant, given that only a pool R/W is managed. In the Salto version, this information was deleted from the log.
The line below provides information about how the property "Maximum cached cursors per connection" of the Generator is configured. By default, it is set with the value 100, which means that up to 100 prepared SQL Statements can be saved in a cache.
Creating Java 2 statement cache: Maximum size 100
As the pool starts to be used, the cache can be completed with up to 100 statements. In that case, when trying to prepare a new one not included in the cache, it first discards one from the cache in order to add the new one.
The following line of the log indicates that a new statement is being prepared and shows information about the status of this cache:
Preparing new cursor BC00027 free 25 used 0 - SELECT...
The FREE parameter indicates the number of statements that have been cached and are available or free to be reused. In this example, they are 25.
The USED parameter indicates the number of statements being used at that moment and which can't be reused.
As long as the number of free statements is lower than 100, the cached statements will be reused. This is indicated in lines similar to the one shown below:
Reusing cursor <cursor name> free 2 used 0 - <sql statement> ???
When FREE reaches 100 (as in this example, or the value of cache size set in "Maximum cached cursors per connection"), some of the cached statements will be deleted in order to create the new statement required. In the log, this is indicated with a line similar to the one shown below:
GX: Dropping older cursor free 99 - <SQL statement>
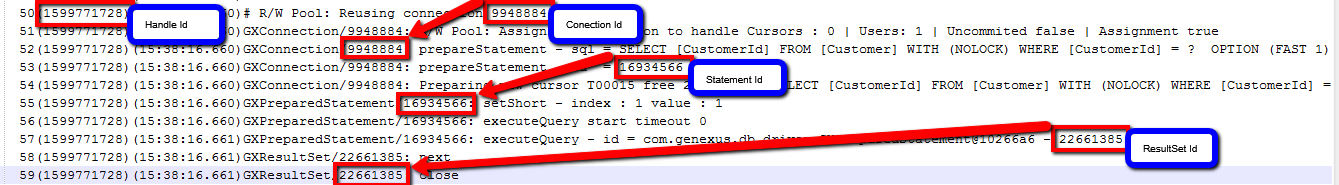
- Handle Id - ID created for each HTTP request made from the web application.
- Connection Id - ID of each new connection to the database created in the pool.
- Statement Id - ID assigned to each new prepared statement added to the statement cache.
- ResultSet Id - ID assigned to the result of running a prepared statement.
It corresponds to the 'Nulls' property of the transaction attributes. In the log, it is displayed for all the attributes whose NULLS property is set to Yes.
When the value loaded in the database is NULL, the log shows wasNull = True; when the value is <> NULL it shows wasNull= No.
Example:
      74(1350767500)(13:30:33.328)GXResultSet/27994965: getString - index : 7 length : 60
      75(1350767500)(13:30:33.328)GXResultSet/27994965: getString - value : TECHNOLOGIES
      76(1350767500)(13:30:33.328)GXResultSet/27994965: getInt - index : 8
      77(1350767500)(13:30:33.328)GXResultSet/27994965: getInt - value : 0
      78(1350767500)(13:30:33.328)GXResultSet/27994965: wasNull : false
      79(1350767500)(13:30:33.328)GXResultSet/27994965: getString - index : 9 length : 1
      80(1350767500)(13:30:33.328)GXResultSet/27994965: getString - value :
      81(1350767500)(13:30:33.328)GXResultSet/27994965: wasNull : true
      82(1350767500)(13:30:33.328)GXResultSet/27994965: getString - index : 10 length : 100
      83(1350767500)(13:30:33.328)GXResultSet/27994965: getString - value :
      84(1350767500)(13:30:33.328)GXResultSet/27994965: wasNull : true
      85(1350767500)(13:30:33.328)GXResultSet/27994965: close
Note: The values of Varchar and LongVarchar data types are not shown in the log on purpose because they can eventually be large values. The values of the others data types are shown.
In the log, search for #Using cached data; for example:
     13(-1)(15:38:21.184)GXConnection/17933228: prepareStatement - sql = SELECT [descGde], [clave] FROM [TBLCACHED] WITH (NOLOCK) ORDER BY [clave]
      14(-1)(15:38:21.200)GXConnection/17933228: prepareStatement - id  = 31737213
      15(-1)(15:38:21.200)GXConnection/17933228: Preparing new cursor P00012 free 0 used 0 - SELECT [descGde], [clave] FROM [TBLCACHED] WITH (NOLOCK) ORDER BY [clave]
      16(-1)(15:38:21.200)GXPreparedStatement/31737213: executeQuery start timeout 0
      17(-1)(15:38:21.262)GXPreparedStatement/31737213: executeQuery - id = com.genexus.db.driver.GXPreparedStatement@1e4457d - 16270214
      18(-1)(15:38:21.262)GXResultSet/16270214: next
      19(-1)(15:38:21.262)GXResultSet/16270214: close
      20(0)(15:38:22.998)ForEachCursor/28027784: # Using cached data for SELECT [descGde], [clave] FROM [TBLCACHED] WITH (NOLOCK) ORDER BY [clave]
The JDBC Log could help us to easily identify whether some connections are not being closed at the proper time or not.
Using the JDBC Datasource from de Application server (instead of the Genexus one) each connection print something like this:
      0(1992275685)(07:10:41.274)GXConnection/-2016438394: Trying to connect to : DataSource : jdbc/DB2_TEST
       1(1992275685)(07:10:41.320)GXConnection/-2016438394: Connected to     :jdbc:as400://h001
       4(1992275685)(07:10:41.320)GXConnection/-2016438394: Database         : DB2 UDB for AS/400 version 07.01.0000 V7R1m0
       5(1992275685)(07:10:41.320)GXConnection/-2016438394: Driver           : AS/400 Toolbox for Java JDBC Driver
       6(1992275685)(07:10:41.320)GXConnection/-2016438394: Version          : 10.2
       7(1992275685)(07:10:41.320)GXConnection/-2016438394: GX DBMS          : com.genexus.db.driver.GXDBMSas400@e54c417b
       8(1992275685)(07:10:41.320)GXConnection/-2016438394: DataStore        : TEST
      11(1992275685)(07:10:41.320)GXConnection/-2016438394: prepareStatement - sql = < SQL SENTENCE>
      12(1992275685)(07:10:41.586)GXConnection/-2016438394: prepareStatement - id  = 732563735
      13(1992275685)(07:10:41.586)GXPreparedStatement/732563735: setLong - index : 1 value : 29962639875
      14(1992275685)(07:10:41.586)GXPreparedStatement/732563735: executeQuery start timeout 0
      15(1992275685)(07:10:41.804)GXPreparedStatement/732563735: executeQuery - id = com.genexus.db.driver.GXPreparedStatement@2baa0917 - -515721487
      16(1992275685)(07:10:41.804)GXResultSet/-515721487: next
      17(1992275685)(07:10:41.804)GXResultSet/-515721487: close
      18(1992275685)(07:10:41.804)GXConnection/-2016438394: GX: Marking cursor as unused [0] - < SQL SENTENCE>
      19(1992275685)(07:10:41.804)GXConnection/-2016438394: close stmt
      20(1992275685)(07:10:41.804)GXConnection/-2016438394: close
We have to verify that each 'Trying to connect to' have a corresponding 'close' connection, with the same handle indentifier (1992275685). If the former exceeds the latter, there is a big chance that some connections are being left opened on that point.
In order to get the difference between "Trying to connect" vs "Close", it is possible looking for , using notepad++ or similar, the following expression:
Open: "Trying to connect to"
Close: "GXConnection/.*: close\n"