Circular charts display data in a circle divided into sectors that are proportional to the quantity they represent. When a slice is selected, it is separated from the rest of the chart.
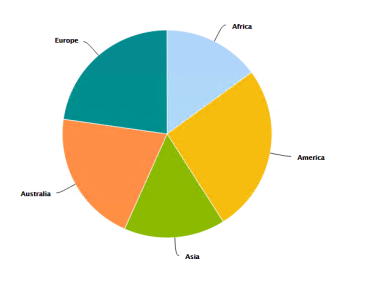
A pie chart has a “pie” like shape. Each value represents a proportional slice of the pie.
| Simple |
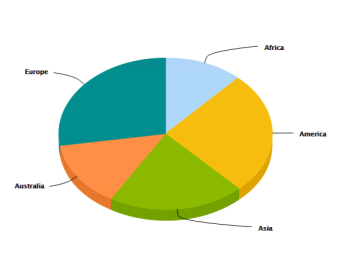
3D |
 |
 |
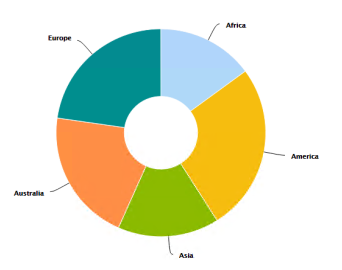
A doughnut has a doughnut-like shape, hence its name (it's like the Pie chart but with a circle in the center of the chart).
| Simple |
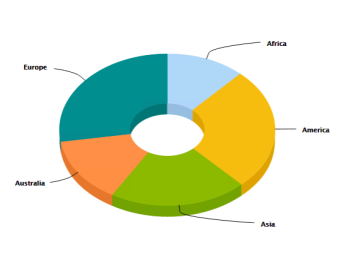
3D |
 |
 |
Note: legends are shown below the chart.