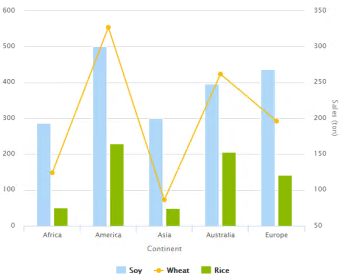
Combination charts allow combining several series of different types into one chart.
A column & line chart combine column and line series, plotting the odd ones as columns and the even ones as lines.
| Simple |
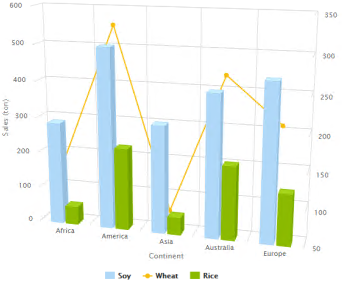
3D |
 |
 |
Funnel charts are a type of chart often used to visualize stages in a sales project, where the top shows the initial stages with the most clients. The funnel narrows as the number of clients diminishes.
Note: legends are shown below the chart.
A pyramid chart consists of a single pyramid with item heights corresponding to each point value. Technically, it is the same as a reversed funnel chart without a neck.
Note: legends are shown below the chart.