Spanish Version
Web Reports
Scope
Product: GXquery Web, GXplorer Web
Introduction
As from the new version, a new query data output type has been added in the Web interface of the tools involving Web Reports. Users will have the possibility of implementing this output, with the design they may deem convenient, within the tool itself. These Web Reports give to the data presentation of the queries all the advantages of a user-friendly HTML design, in addition to new and easy information print features.
Description
Until the previous version, the possibilities to visualize queries result in GXplorer and GXquery Web were only the following:
- Pivot Table de Microsoft Office Web Components
- Microsoft Office Web Components Chart
These outputs allow for an easy and quite dynamic manipulation of the data obtained, but you must frequently give a customized format to this information, such as for data printing, reports presentation, inclusion of company information in the output, etc.
In the new version, besides the externally developed Customized Output it is also possible to design a customized output within the tool itself. Within GXplorer and GXquery Web interface, there are two new tabs that allow editing and visualizing a Web Report to show data in a customized way.

Edition
The edition is made in an HTML editor included in the Edit Report tab, as shown in the figure.
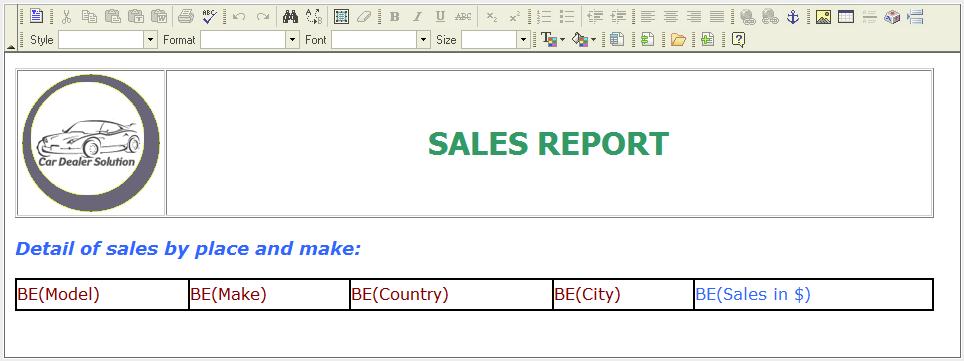
This editor is based on the FCK Editor, an HTML Open Source editor, and it allows the basic HTML edition features such as inclusion of tables, texts and images, fonts formatting, etc. It also includes two extra options that allow adding the query components (measures, dimensions, attributes).
The option  opens a window that allows including query attributes in flat view in the HTML form.
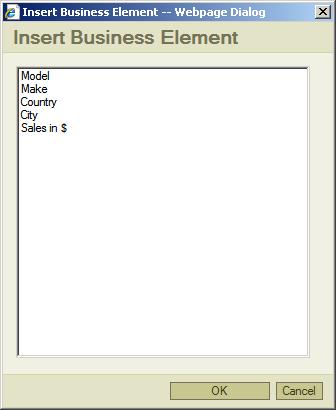
A report page will be generated per each combination of values of the attributes included in flat view. The different pages will be visualized one by one, using navigation buttons, or all together, one after the other, if you select the "All pages in the same document" option.
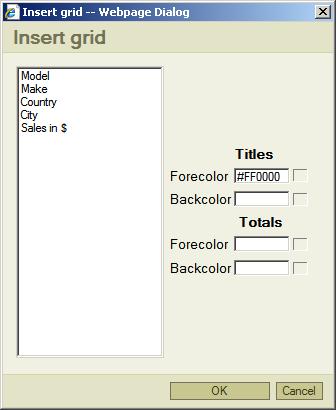
This second option  allows including grids containing attributes. The attributes included in a grid will not generate different pages. Instead, all values will be shown within the grid, one after the other, in the same document, including the titles and totals, whose look&feel can be setup in the selection window.
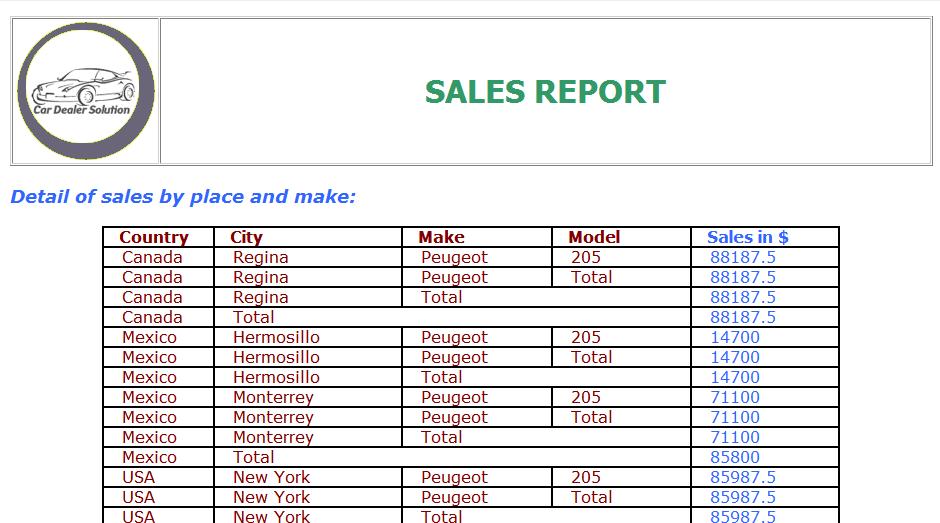
Visualization
Another tab is included that allows visualizing the Web Report. When you move from the Edition tab to the Visualization tab, a verification of the Report specification is performed. In case everything is right, the report(s) is (are) generated and the data obtained in the query are shown with the indicated design. If there is a specification error, a message is displayed detailing the error.
The visualization screen also includes three buttons that allow executing actions on the Web Report output.
The  buttons allow navigating through the different reports generated, in case more than one was generated. The
  option opens the PC print dialog to send the report(s) to a printer or to a PDF file.