Download it
The Fusion Charts User Control enables your web site to display incredible, dynamically generated charts. The Fusion Charts control is based on http://www.fusioncharts.com/free/ which provides a free set of charts based on Flash technology.
To start using the control, drag the Fusion Charts Control to a web panel (or transaction). After that you will see the chart in your web form and its properties in the Properties window (which can be activated from the View menu). In addition, when dropping the Fusion Charts Control, one Structured Data Type (FusionChartsData) and one Data Provider (DPFusionChartsData) will be imported.
The main idea is that you will give the Fusion Charts Control a FusionChartsData based variable containing the x,y values that have to be displayed in the chart. The FusionChartsData SDT contains three fields:
- SeriesName: X values to be displayed in the X axis
- SeriesValue: Y values
- SeriesColor: color to be used for this series
Example using the provided Data Provider:
//the Data Provider outputs a FusionChartsData SDT
FusionChartsData
{
    FusionChartsDataItem
    {
        SerieName  = "Product A"
        SerieValue = 10
        SerieColor = "8BBA00"
    }
    FusionChartsDataItem
    {
        SerieName  = "Product B"
        SerieValue = 20
        SerieColor = "D64646"
    }
}
//Sample code for FusionChartsData
Sub 'FusionChartsDataSample'
  &FusionChartsData = DPFusionChartsData() //&FusionChartsData is based on FusionChartsData SDT
EndSub

Event Start
   Do 'FusionChartsDataSample'
EndEvent
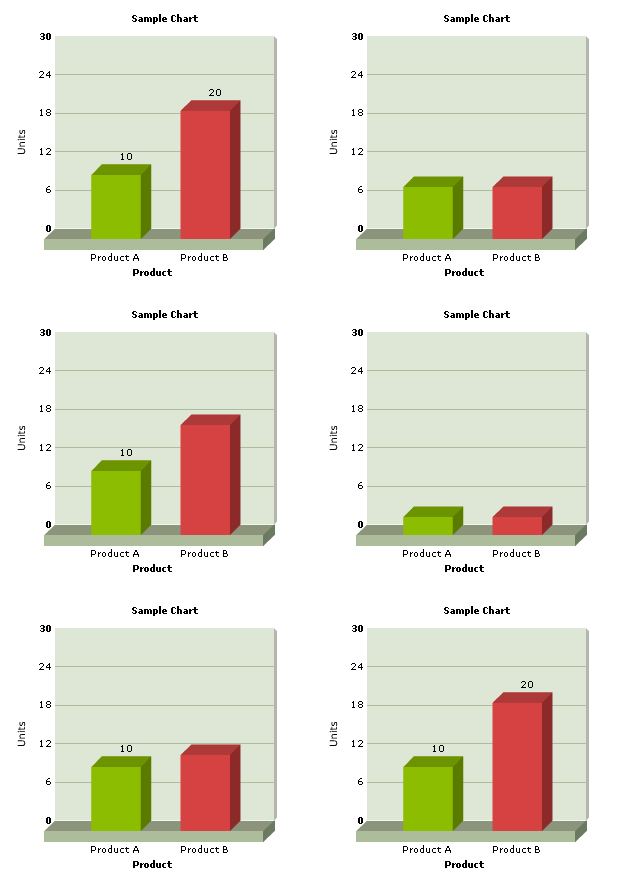
The example shown above will create a chart like the one below:

Control Properties
| Property |
Description |
| Caption |
Main Chart Caption |
| ControlName |
Name of the control |
| decimalPrecision |
Decimal Precision |
| formatNumberScale |
Format Number Scale |
| FusionChartsData |
SDT &variable that contains the data |
| FusionChartsType |
Chart Type |
| Height |
Chart height in pixels |
| PathToCharts |
Path to charts, needs to be changed according to the generator (eg for .NET and Ruby FusionChartsControl/Charts/ and for Java ../static/FusionChartsControl/Charts/) |
| Width |
Chart width in pixels |
| numberPrefix |
Number Prefix (eg: $) |
| Random |
Default: True ; indicates that a different chart type will be displayed when the page is refreshed |
| SubCaption |
Sub Chart Caption |
| xAxisName |
Title to show on X axis |
| yAxisName |
Title to show on Y axis |
| VersionNumber |
User control version number |
Please refer to http://www.fusioncharts.com/free/TermsOfUse.asp?gMenuItemId=9
- Add support for multi-series chart
Please visit: Default Installation Instructions for User Controls.
Please send feedback to: acardoso@simplifica.com.uy
2008/04/01: New properties added (PathToCharts and VersionNumber).
2008/04/26: Version 1.2 uploaded. FusionChartsData property was not properly assigned.
2008/08/12: Minor fix to support more than one graph on the same web panel