This control shows a dynamic chart to explore several indicators over time. The chart is rendered within the browser using Flash.
The user control is really simple, you just need to set one property in order to get the control working, the Series property.
- Drag and drop Motion Chart.
- Assign to Series property a variable based on TimeSerie data type (this SDT is automatically imported when dropping the control to the web form).
- Load the information that will be shown by the chart using the previous mentioned variable.
Sub 'LoadMotionChart'
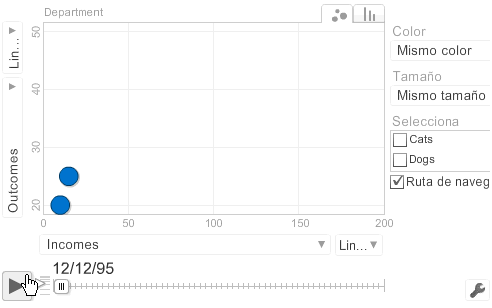
GoogleMotion1.Title = "Department"
GoogleMotion1.XTitle = "Incomes"
GoogleMotion1.YTitle = "Outcomes"
&item.Date = ctod("12/12/1995")
&item.Name = "Dogs"
&item.X = 10
&item.Y = 20
&serie.Add(&item)
&item = new()
&item.Date = ctod("12/12/1995")
&item.Name = "Cats"
&item.X = 15
&item.Y = 25
&serie.Add(&item)
&item = new()
&item.Date = ctod("12/12/1996")
&item.Name = "Dogs"
&item.X = 110
&item.Y = 50
&serie.Add(&item)
&item = new()
&item.Date = ctod("12/12/1996")
&item.Name = "Cats"
&item.X = 190
&item.Y = 30
&serie.Add(&item)
EndSub
Note: &item is based on TimeSerie.Category and &serie is based on TimeSerie SDT.
Motion Chart Control is based on Google Motion Chart.