This document gives the first approach for debugging Native Mobile applications by inspecting log messages.
The first thing you must do is to set the Enable Logging property in True (default value), and then indicate the log level to record for each feature.
This action can be made by setting the following properties at the Native Mobile Main object's level:
You must build and run your Native Mobile application (Main Object).
There are two ways to debug Android applications, all of them by using the LogCat tool.
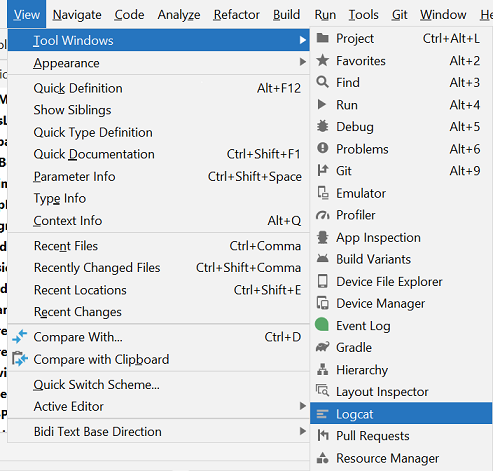
1) By using Android Studio
If you are using Android Studio, you can run Android LogCat by navigating from View > Tool Windows > Logcat .
There are three ways to check the generated logs in Apple applications.
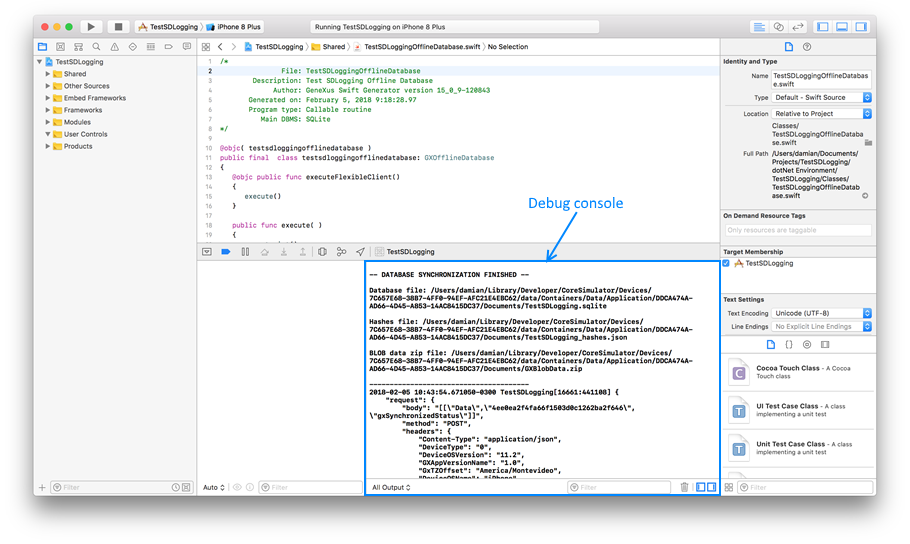
1) By using XCode Debug Console
The developer should open XCode and run the application from it. Then, log messages will be displayed on the debug Console.
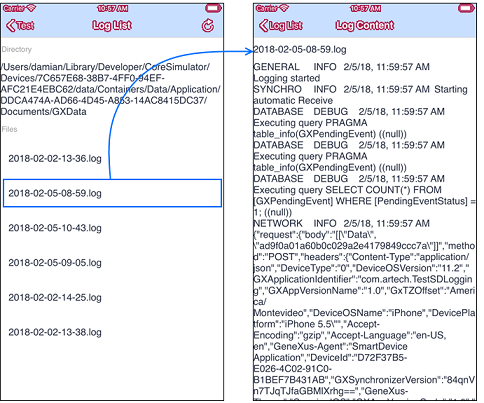
2) By inspecting application log files
The application will generate *.log files in its data path (accessible from Directory.ApplicationDataPath). Then, you can read it from the application and send a report, or simply display its contents on it. The following example displays log files and their contents directly on the application (download it here, and include it in your KB).
3) By using logfile from simulator
Once the application is launched in a simulator (e.g. by F5 from GeneXus), the developer can inspect the log by doing Debug > Open System Log... from the system bar (or ⌘+/ shortcut).
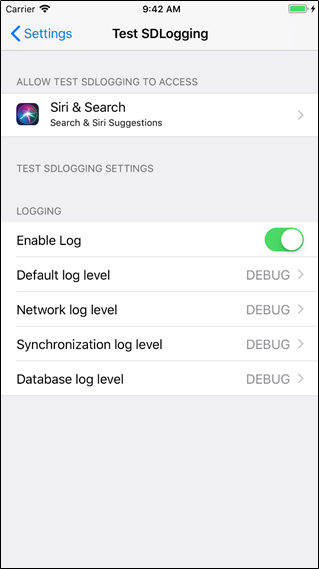
- With Apple applications, instead of setting logging properties with GeneXus, you can enable logging by going to Settings > <your_app> and turn on Enable Log switch (and which log level desires).
Generators: Apple, Android
Download UILogging module
Apple Developer - Debugging Tools
Android Developer - Write and View Logs with Logcat