Show how to read logs generated by HPROF (looking for a memory leak diagnosis) without using graphical tools like hpjmeter or others.
When working on performance analysis (in particular, trying to diagnose a memory leak problem) one possibility is to generate HPROF dumps at regular time intervals without restarting the application (because it would shut down the java virtual machine and the information of memory allocated objects would be reset). In this way, the information on the evolution of memory usage can be stored in one log.
Another possibility is to get a memory dump when the application goes down (just one dump when the application throws out of memory error). This gives useful information also because the dump is generated just before the VM goes down (if this is the case), so the dump will show the objects wich remained alive and the percentage of memory used. However, we'll concentrate on the interpretation of n dumps generated by hprof during a java application execution.
Note:
It's recommended that logs be generated with the following options:
* heap=sites (in order to obtain only relevant information)
* depth=10
http://java.sun.com/developer/technicalArticles/Programming/HPROF.html
In case you have successive dumps with their corresponding generation date and time, you can have an idea of the use of memory objects in each one of those time intervals.
You should look for suspicious objects that are created and remain alive during several time intervals, without being deleted as time goes by.
We start by reading the SITES section of the log which shows as follows:
SITES BEGIN (ordered by live bytes) Mon Mar 2 13:22:38 2009
percent live alloc'ed stack class
rank self accum bytes objs bytes objs trace name
SITES : is a sorted list of allocation sites. This identifies the most heavily allocated object types, and the TRACE at which those allocations occurred.
Percent indicates the percentage of memory usage. The higher the percentage, the higher the potential memory leak.
Alloc'ed is the number of objects and bytes assigned to a memory allocation.
Live are the objects and bytes which remain alive.
The number of Live objects should decrease in relation to the alloc’ed objects during time intervals.
If you find a class whose live objects remain the same along time, and also the percent of memory used is high, you should search for the stack number in the log.
There you will find the stack trace of the classes involved in the creation of those objects (TRACE section of the log). In order to obtain a complete stack trace and be able to view the involved classes in more detail, the depth should be set to 10 or more, as explained above.
1. Look for suspicious objects that are created and remain alive:
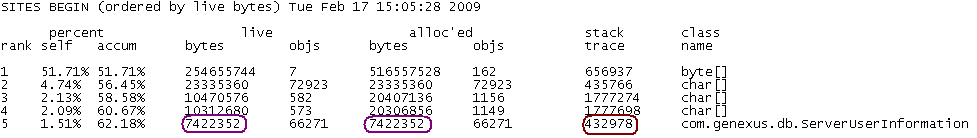
2. Search the corresponding TRACE number in the log to find the stack trace of the suspicius object. From now on, you only have to investigate the classes involved.
TRACE 432978:
com.genexus.db.UserInformation.<init>(<unknown source="">:Unknown line)
com.genexus.db.ServerUserInformation.<init>(<unknown source="">:Unknown line)
com.genexus.db.ServerDBConnectionManager.getNewUserInformation(<unknown source="">:Unknown line)
com.genexus.db.DBConnectionManager.createUserInformation(<unknown source="">:Unknown line)
com.genexus.GXProcedure.<init>(<unknown source="">:Unknown line)
com.genexus.GXProcedure.<init>(<unknown source="">:Unknown line)
aproctest.<init>(aproctest.java:46)</init></unknown></init></unknown></init></unknown></unknown></unknown></init></unknown></init>
Related links:
Hpjmeter: diagnose performance problems