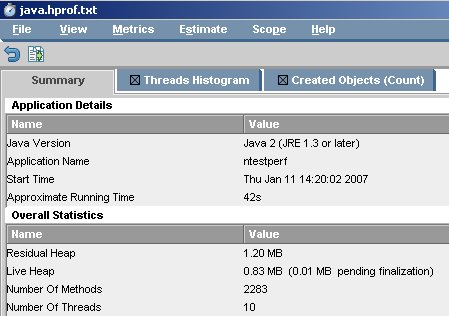
This is a brief document which explains in which cases HPjmeter can useful for diagnosing performance problems (detect memory usage and inefficient code). Note that there are also other tools which have the same purpose (eg. Jprofiler).
Start the application with the following system properties (command line profiling tool called Hprof for heap and cpu profiling):
-Xrunhprof:file=<path>\java.hprof.txt or
-agentlib:hprof=heap=all,thread=y,cutoff=0,format=a,doe=n
The generated log can be opened by HPJmeter afterwards.


In general terms, by using this tool you can achieve:
- Automatic problem detection and alerts
- Memory leak detection alerts with leak rate
- Thread deadlock detection
- Abnormal thread termination detection
- Expected out of memory error
The HPJmeter tool can be used with different goals, monitor applications is one of these goals, another one, is analyzing profiling data, and garbage collection data.
Please, note that this tool provides very low level information about classes and methods activity.
Here we will concentrate on using HPjmeter to Analyze Profiling data.
You can have the answer to the following:
- How many times each method was called.
Detect also which methods call a specific method. You can make a call graph of methods. This is useful in order to know which methods are the callers of a specific method that you suspect that is a bottleneck.
- Metrics: Detect method times (how much time is spent in a method).
- Detect class times (how much time is spent in executing a class).
You can also see the time spent by each method of that class.
This metric is useful for determining if one class or group of classes are responsible for the mayority of the time spent in the application. Then you can try to improve the performance of that classes that are potential bottlenecks.
- Number of threads created by the application.
View the lifetime of threads. Relative porcentage of CPU time, locking or contending for locks, iddle/wainting time, an I/O of each thread. All these help in determining which threads should be studied in more depth.
- The number of each type of object that was created, and where (which method) did create it.
HPJmeter has also "Guess functionalities" for instance, it can detect possible lock contention problems in methods.
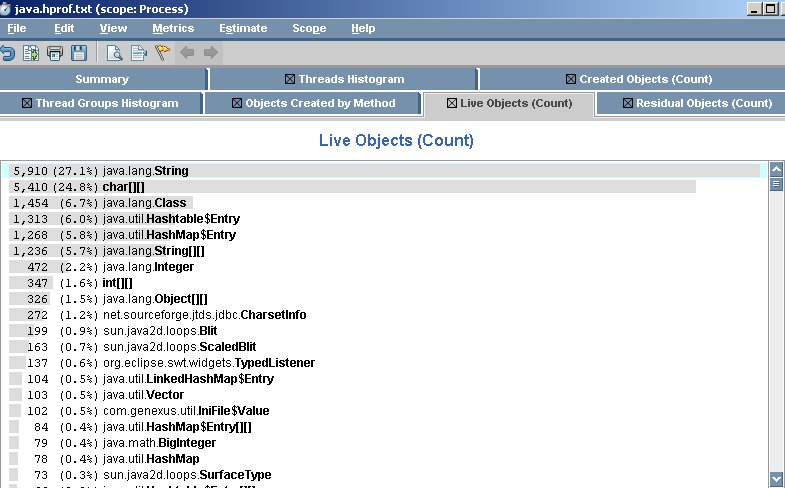
Viewing residual objects is another interesting funcionality which is very useful when you suspect of a memory leak in your application.
Residual objects are those objects that remained in the heap upon completion of the application.
This reveals possible memory leaks in the application (objects that still have references to the application, but are no longer needed by it).
The way to determine the possible memory leaks is to compare the amount of created objects of each type, versus the amount of live objects when the application has already ended.
In general these logs can be sent to support in order to be analyzed in ARTech.
JMX Monitoring Tools