Profiling is used to help fix performance problems by means of running the application and keeping track of what was executed, how many times and for how long.
Follow these basic steps to profile your application:
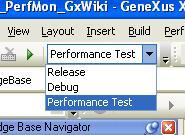
1. Change to Performance Test mode
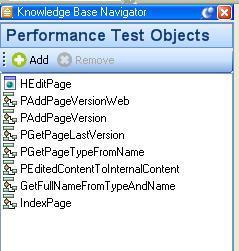
2. Add objects to the Performance Test Objects tool window. These are the objects that will be monitored
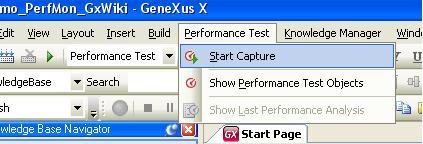
3. Select Menu / Performance Test / Start Capture to start capturing performance information
4. The profiler is capturing information:
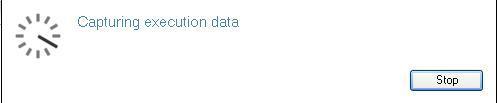
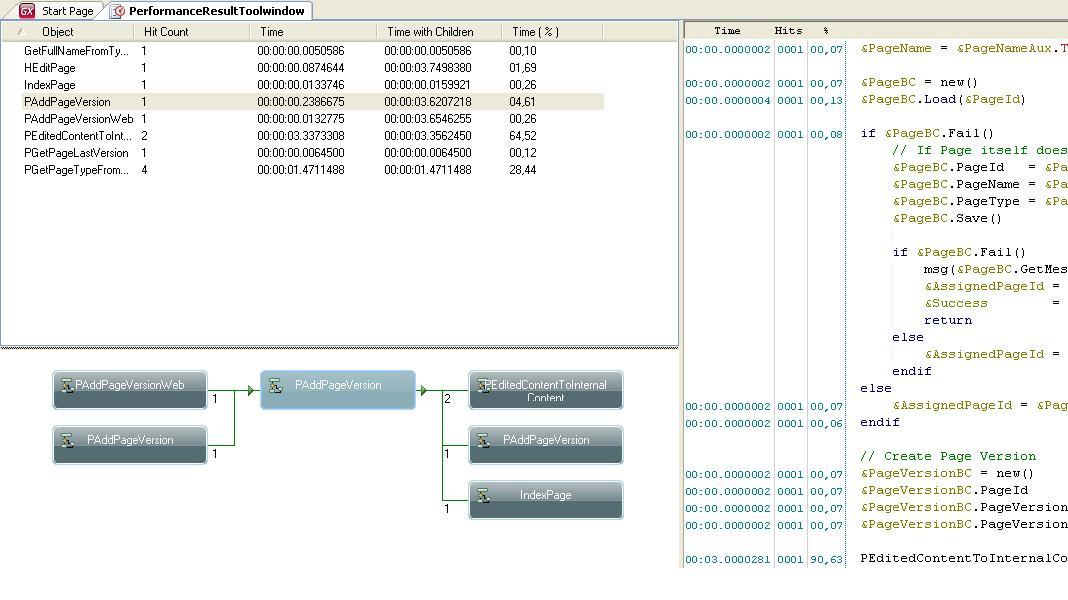
5. Execute the application and select Stop when done. The performance analysis tool window is displayed for you to analyze
Important:
- This feature only applies to objects without an interface, as Procedures or Data Providers. Otherwise, the results could be distorted by time interface.
- The profiler uses a port number to establish a connection with GeneXus. In case of connection problems see GeneXus Debugger and Profiling common issues
Debugging in GeneXus
GeneXus Debugger and Profiling common issues