This feature in GeneXus lets you know to which degree the code you wrote in a program is executed. It is used also to help fix performance problems by means of running the application and keeping track of what was executed, how many times, and for how long.
On this page, you will find information on how to configure GeneXus to generate source-level runtime code coverage and performance information and analyze the results.
First, you must set the Generate Code Coverage information property to 'Yes' and rebuild all
Once the Rebuild All operation finishes, run the objects you are interested in. A file named “gxperf.gxd” will be created (or updated in case it is not your first code coverage run for the environment).
To open this file, go to Toolbar > Test > Code Coverage.
A document window will be opened, where you must select “...” and locate the file under “<KBLocation>/<EnvironmentPath>/web/gxperf.gxd” path.
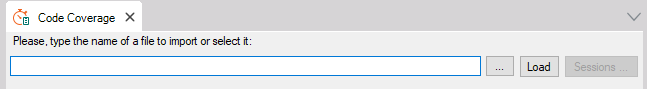
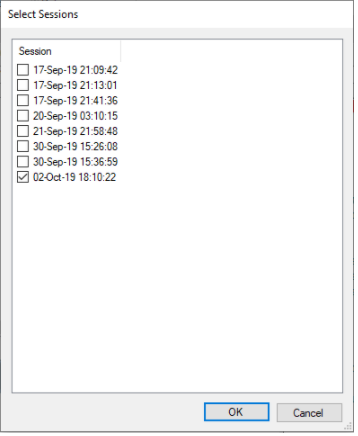
Once you selected the file, a prompt window is shown to select which session you are interested to see. Select all you want and click “OK”
Now Code Coverage window is updated like this:
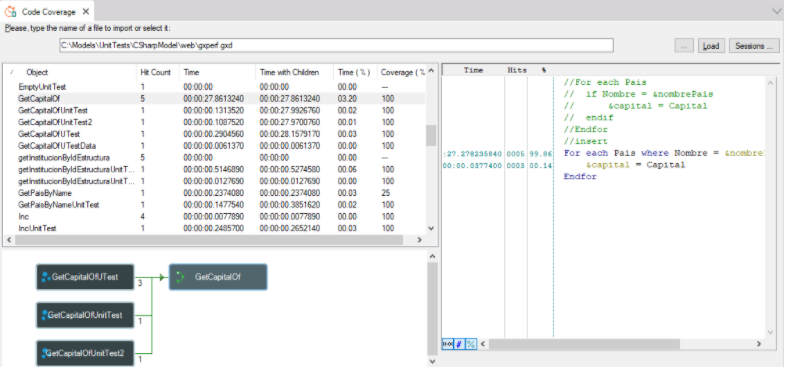
On this window, every object involved in selected executions is loaded with information about hit count, time, time with children, time percent and coverage. Also, when an object from this list is selected, a graph indicating the call tree is shown and the line codes with their respective trace information too.
What is being measured with an object or line granularity:
- Hit Count or Hits: Number of times it has been executed
- Time: Elapsed Time
- Time with Children: Elapsed Time, adding the elapsed time of the objects called by it
- Time (%): Total percentage of the elapsed time related to the rest
- Coverage (%): Percentage of coverage of that object (lines that were executed / total number of lines)
A clarification about the percentage shown in the Coverage (%) column, if you choose to load N sessions and:
- the object was exactly the same in every session and it's the same as the object's current version in the KB; then the accumulated coverage is shown
- the object was exactly the same in every session but it's not the same as the object's current version in the KB -because it was modified-; then the accumulated coverage and a message in red indicating this situation are shown
- there are different versions of the same object in the different sessions; then #### is shown indicating that coverage percentage can not be calculated
You can change the name of the generated file by running command line procedures adding an extra flag:
- .NET & .NET Core: /gxperf:<TraceFileName>
- Java: -Dgxperf=<TraceFileName>
This property is available since GeneXus 16 upgrade 8.
Test Coverage