Test execution results are shown in the Test Results window. This window is composed of two main sections: the left one that contains a summary of the entire execution, and the right one that shows details of a selected node in the left section. More detail about every component of this window is presented below.
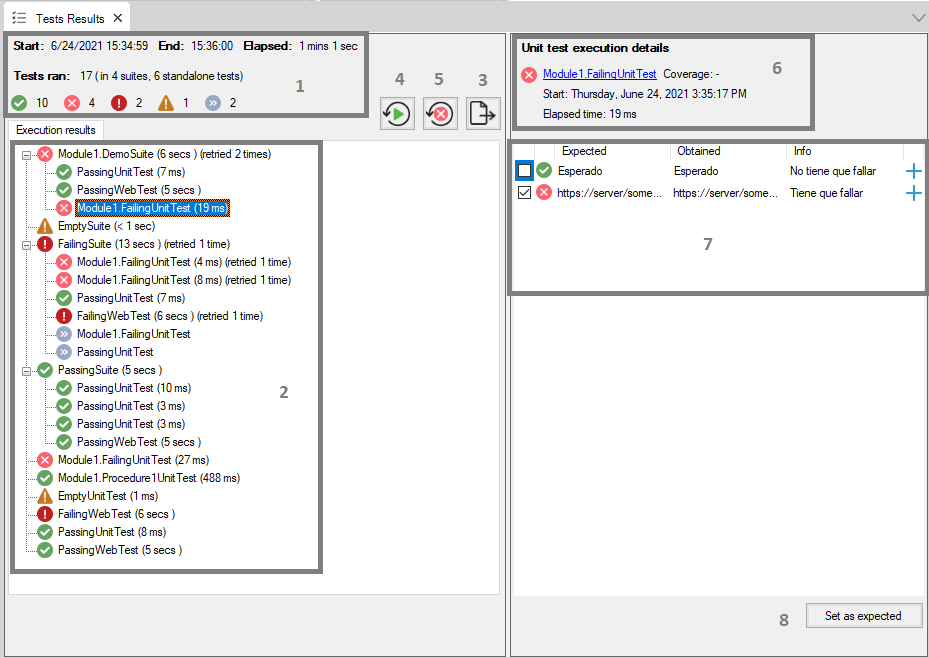
This section gives the user an overview of the execution of the tests performed.
The start date and time of the execution itself and the elapsed time are displayed on the first line.
The number of tests ran, i.e. the number of tests that ran indeed, not taking into account skipped tests is displayed on the second line. This count includes the tests that ran within a suite and those that ran independently.
Tests are grouped up by their result on the third line: ok, error, exception, warning, and skipped to provide more information at a glance. All test executions are considered here.
In this section, a tree of the executed test suites and tests is displayed. For each one the information displayed is:
- Tooltip: indicates the type of the hovered test object (Web UI Test, Unit Test, SD UI Test, or Test Suite)
- Icon: status of the current test (ran with an exception, ran with errors, ran with warnings only, ran successfully, or skipped)
- Name: shows the qualified name of the test. Click it to view its details on the Commands + Assertions detail section and double click it to open the test object
- Time elapsed: elapsed time for the test object execution
- Retries made: for test objects that were retried it shows the number of retries performed
When clicked, a File System window is prompt to select a path and file name to export the execution results in HTML format.
If clicked, the last execution is repeated, i.e. the test and suite results currently displayed in the Test objects results tree area.
If clicked, the failed items of the current results run again. Take into account that if a Test Suite had only one failed test, the whole Test Suite will be executed again.
In this section, detailed information about the selected test object in the Test objects results tree section is shown.
- Test result status image + Test's qualified name as a link label. Click the link to open the test.
- Browser: if the selected test is a Web UI Test, the browser and version where the test was run on is shown.
- Coverage: coverage percentage that the test made of the called object/s. See Test Coverage article.
- Start date: full date and time when the test started its execution.
- Elapsed time: test's execution time
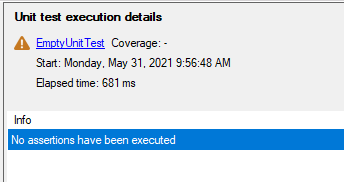
In this section, a list of the executed testing actions is shown. For unit tests, this means assertions only and an exception if occurred. For Web UI Tests, besides assertions and the exception, all commands are shown. If no step is executed for a test, then this section is shown as follows:
Since the information being displayed is different depending on the selected test object type, they are presented separately here.
- Check box: to select assertion results (see Set as expected button below)
- Assertion result: shows the assertion result. Typically error or success
- Expected value: the expected value, the first parameter of assertions
- Obtained value: the obtained value, the second parameter of assertions
- Info: information added by the user, useful to identify the assertion made or just add information about the test case for example
- View more: Click on these buttons to open a comparer window to see differences between expected and obtained values in a better way, using the GeneXus comparer tab
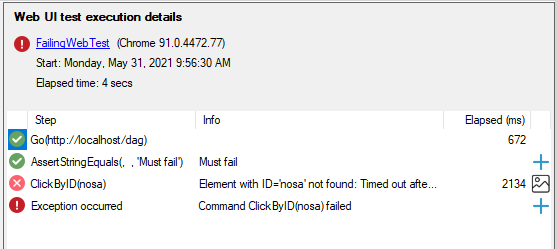
- Step result: an image stating the execution result of the step
- Step: executed command name and the parameters used for it. Also, assertions are considered steps for Web UI tests
- Info: For assertions is shown the same as the Info column for unit tests. For web commands, this column is used for failure messages or similar
- Elapsed: the elapsed time for the command
- View more: for assertions and exceptions, a + sign is shown. If this button is clicked for an assertion, then the assertion comparer is opened like explained in the Unit Test columns sections. If it is an exception, then a tab showing the stack trace is displayed. For commands, depending on the configuration for the KB, an image icon is shown. If this icon is clicked, then the screenshot related to that command is opened in a new tab
Suite execution detail
When a test suite is selected the following information is displayed
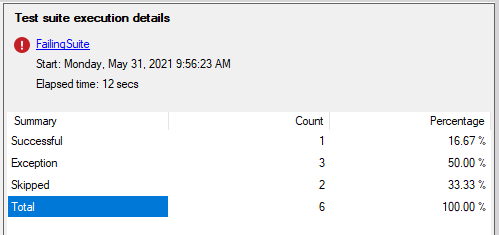
The grid presents a summary of tests count grouped by their results and the corresponding percentage of the total for the selected suite.
If clicked, all assertion results checked are used to replace obtained values on the current execution as expected values in the appropriate Data Provider. The goal of this feature is to be used when it is known as a fact that the tested object works as expected, so the obtained results are correct and not the expected values. For this reason, only failed assertions are checked by default.
In order for this feature to work properly, the assertion message must follow the format: TestCaseId.ExpectedFieldName: ...
Supported types to use with this feature are:
- Boolean
- Date
- DateTime
- Varchar, LongVarchar, Character
- Plain SDTs
- GUID
- Numeric
- Domains (including Enumerated ones)
- Blob
- Collections of these types
Availability: this feature is available since GeneXus 17 upgrade 2.