New options and improvements have been incorporated about Reporting in GeneXus 15 to create more and better Reports.
Below are the new features included:
1) As we know, to have a certain Query object displayed in a QueryViewer control that is included in a web form, the necessary association can be made from the properties dialog of the QueryViewer control or via code (when the Query object receives parameters, it must be assigned via code).
The image below shows the definition of a Query object, as well as the difference between the code that had to be defined in previous versions and the much simpler code used to achieve the same objective in GeneXus 15:
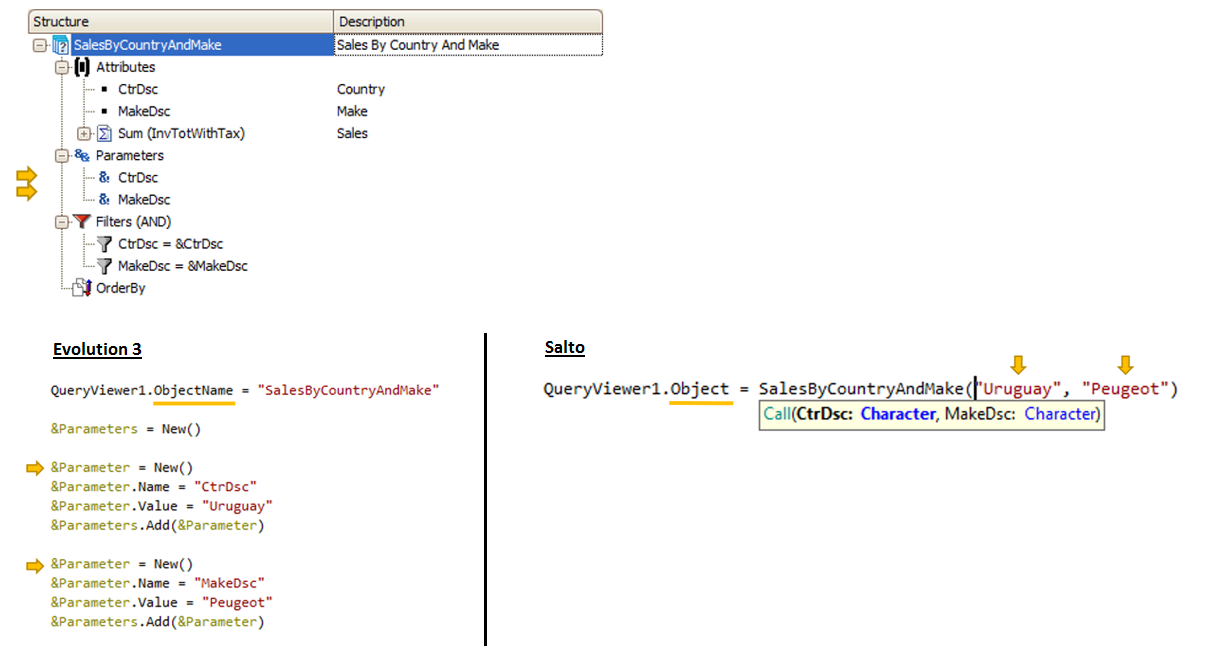
Advantages of the new syntax:
- It is more compact
- It provides tooltips
- When object references are queried, the reference appears
Note:
The previous syntax is kept for compatibility reasons and also because it's more versatile (if the association has to be made in a dynamic manner, that is to say, by associating several Query objects to the same QueryViewer, depending on certain conditions, it may not be possible with the new syntax unless a big CASE is used. All the Query objects must be known beforehand).
2) New Query output type: Card
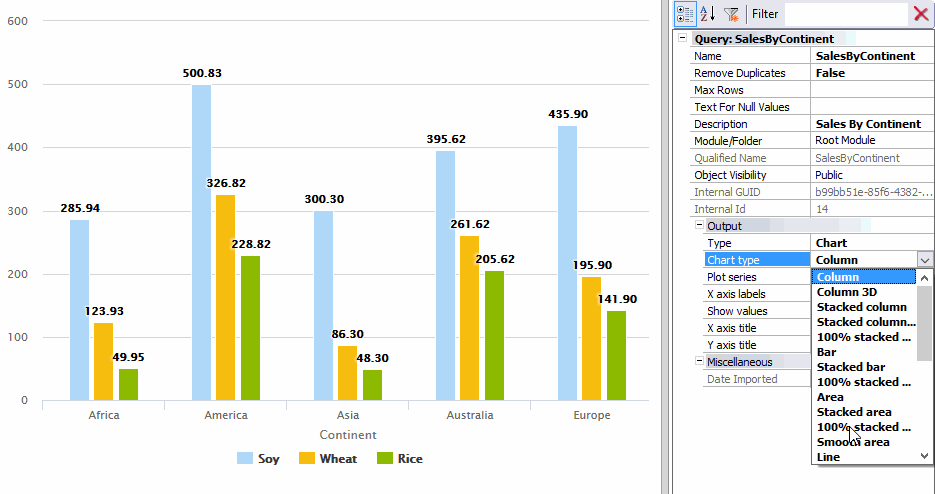
3) In version Evolution 3, the Query object Preview was very basic. It charted only a few of all the properties set (for example, the output type; if the output was a pivot table, the axes could be moved in the Preview itself).
GeneXus 15 offers a much more powerful Preview that reflects almost everything we set.
The following demos show the power of the Preview feature:
Chart Preview
Pivot Table Preview
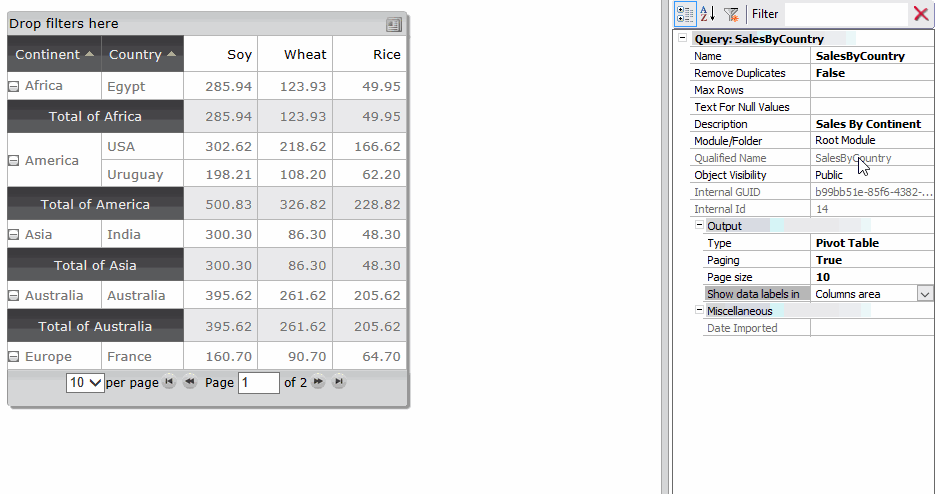
Note: attributes can be hidden in the Pivot Table just by right-clicking upon the right corner of the attribute. In the Pivot Table case, remember that if all the Data attributes are hidden, the Quantity field will appear without having the possibility to hidden it.
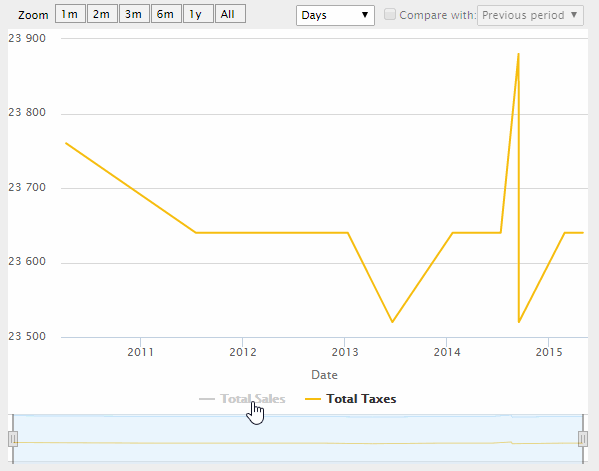
5.1 Several improvements to the TimeLine Chart are available.
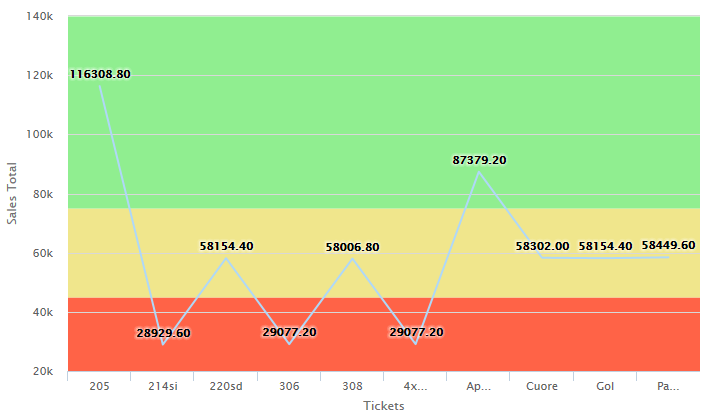
5.2 Now, Charts which has X and Y axes takes under consideration the conditionals styles defined in the query indicators displaying the differents ranges with differents background colors:
5.3 New Chart Types have been added:
5.4 Since GeneXus 15, the output is only JS + HTML5 to be mobile friendly.
5.5 About Tables and Pivot Table: AggregationChanged Event and Aggregation Changed Data property are now deprecated.
Please see the following GX26 session which describes all the GeneXus 15 Reporting features: ¿Cómo transformar los datos en información? (Spanish only).