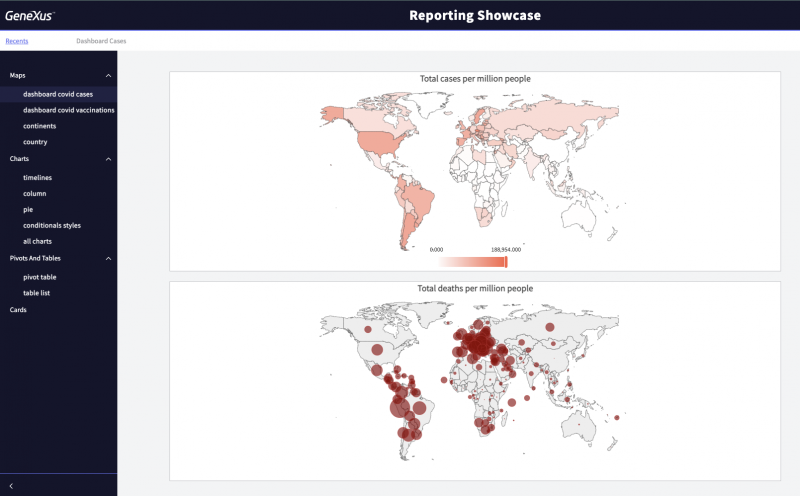
This Knowledge Base contains examples to show how you can create Query objects and Dashboard objects and present the data in different charts, pivots, or maps.
You can create a new Knowledge Base based on this KB and then explore the implementation of each sample.

Also, here you can see the examples at runtime.
For this Knowledge Base, the Unanimo Design System is used.
1. Create a new KB from GXServer
GXserver: https://samples.genexusserver.com/v18
KB: ReportingShowcase
Version: Stable
2. Rebuild all
3. Execute InitData webpanel and press all the buttons (from top to bottom) to load each data set.
Unanimo Design System
To generate this Knowledge Base you need to use GeneXus 18 or higher.