The GeoCity Knowledge Base contains examples that show how to use Maps in Native Mobile Applications and an example of Smart Cities Applications.
You can create a new Knowledge Base based on this KB and then explore the implementation of each sample.


 .
. 


This version is based on Open Data of the city of Montevideo. To create your own GeoCity for your city, search for Open Data and modify the Procedures and Data Providers located in the "Input Data" folder. The set of objects stored in the "Generic" folder are there to document the different ways available to populate Geography Data.
For it to work properly, run the InitDB Procedure and then the GeoCity Panel object.
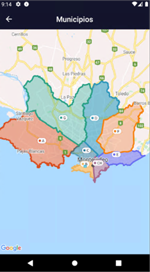
This is an example of loading and viewing a file in KML format.

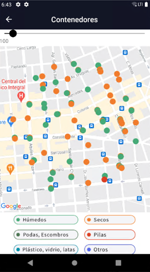
Containers Panel, it is an example of POI (Point of Interest). The panel allows not only to view N positions in the maps (containers), but also allows you to view them depending on their categorization, with different colors, and allows you to filter by the same
It also offers a zoom control, so you can view only the containers within a radius of distance.

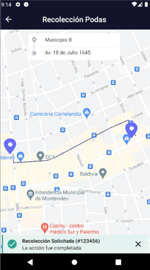
"RecoleccionPodas" Panel, it is the typical example of an Uber client application. This allows you to enter a destination address and, from a source address, show the most optimal path between the origin and the destination.
The path obtained by the Google direction service that is invoked can simply be displayed on the map, or can be stored in the database (in the Geoline data type format)

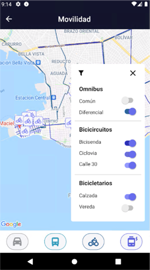
"Movilidad" Panel, it’s an example of data layers. There, different layers of data are displayed, which are originally obtained from open data in different formats (geojson, kml, feature collection, etc.). Bus routes (BusWay), Bus Stops (Bus Stop), bike routes (BikeWay) and stationary bikes are some of those layers
Using a control that moves horizontally, the different layers can be turned on or off.

"Incidentes" Panel, it is an example of Editable Maps, where the entry of geographic data is allowed by drawing on the map itself.
It is allowed to input either Geopoints (Fallen Trees), Geolines (roads in poor condition) or GeoPolygon (Garbage Dumps).

"Clima" Panel, it is an example of Polygon Display and Update their UI in Runtime.
The alert areas in your weather forecast are displayed with different colors. Tapping on the area allows you to view information about it and change its appearance (FillColor, BorderColor)

"DescargaMapa" Panel, it is an example of Offline Maps, which allows you to download the map of a specific area to your device and access it offline.
This functionality is only available for the Mapbox provider, more information here
Important:
To host this application locally, you must set a valid Google API key in two places:
Check HowTo: Get an API Key from Google
Geography data type
To generate this Knowledge Base, you need GeneXus 17 Upgrade 6 or higher.