This document attempt to provide a detailed list of needed steps when using Query object and QueryViewer control.
This example it's based in the University reality, which includes concepts such as Students, Careers, Courses, Instructors, Colleges, and the enrollment of Student to Courses.
Many scenarios can be resolved by using a Query object, so let's focus on solving the following problem:Exam statistics by Career, Course, and Student.
Note: It's assumed that the Query object and QueryViewer control documents had been read and the basic concepts, such as query object's structure, are known.
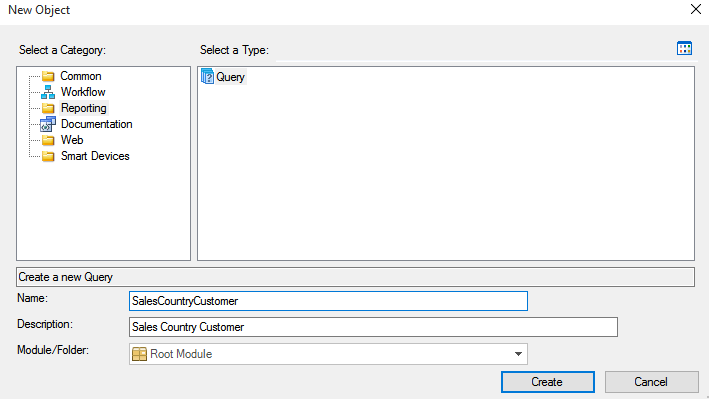
Create a Query object with the name SalesCountryCustomer.
To define the query's result attributes must be added in the Attributes node under the Structure tab.
There are two different ways to include those attributes: drag them from the Work With Attributes window and drop them in the query:
Or write the attribute's names in line:
Notice that a suggested mechanism is available to make this task easier.
Use one method to include the following attributes in the query: CareerDescription, StudentName, PassingTestDate, and PassingTestResult.
Once the attributes are under the Attributes node, check the Description column of each one and set the desired descriptions to be shown.
Remember that descriptions are shown when the query is executed in the Preview tab or runtime.
Then, we have to indicate how all the selected attributes are going to participate in the query.
There are many options to select for the attributes; among others, we can:
- Define aggregation functions to the attributes, i.e. Sum, Count or Average.
- See the values of an attribute regarding percentage.
- Define filters to the components of the query using values lists, ranges or filters by others attributes
Apply the Average function to the PassingTestResult attribute and Count function to the PassingTestDate attribute.
Again, there are two ways to perform this action: right-clicking on the attribute and selecting the wanted aggregation or by writing the text the formula in line.
Note that the suggested mechanism, mentioned in the previous steps, also takes into account aggregation functions when suggesting elements to add into the query.
Sometimes it's very useful to have an early result of the query in order of knowing if it's displaying the wanted results.
To do so, select the Preview tab.
Suppose we want to filter to get just those Students with more than two tests done.
To do so, we need to define a filter in the query, so return to the query Structure and over the aggregated PassingTestDate attribute include a filter group selecting the appropriate option in the right click menu.
The filter can be written inline or can be defined using the right click options available in each level.
The new query structure will look like the following picture:
Return to the Preview section, and after a recalculation of the SQL statement needed, the new query result is displayed in the default output.
So far, we have defined the query to execute. Now, we need to include it in the application to be visible for the users.
For a Query object to execute in runtime, it needs a special control denominated QueryViewer control. This control needs to be dragged and dropped into a Web Panel object.
Then we need to set the control properties, so configure the Object property with the name of the Query object or Data Provider object which will be displayed.
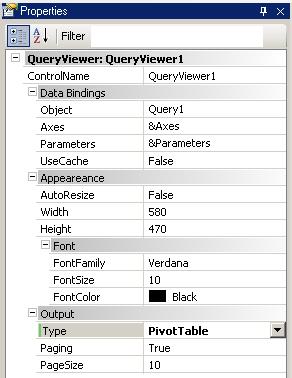
The final step is to display the query at runtime, so run the application (F5) and open the Web Panel. At execution time, it will look as shown in the figure below:
Notice that in this case, we created a Web Panel object with three graphics using different outputs.
The Query Object sample application has a WebPanel with several Queries using the QueryViewer control.
Download the proper KB version:
The QueryViewer Basic Samples shows how to use the Query Viewer Control to build a kind of dashboard for the classical Invoicing data model; download the KB from here.