When creating enterprise applications, it is always needed to have the best reports in order to make the best decisions. To accomplish that, GeneXus provides you with a variety of possible solutions.
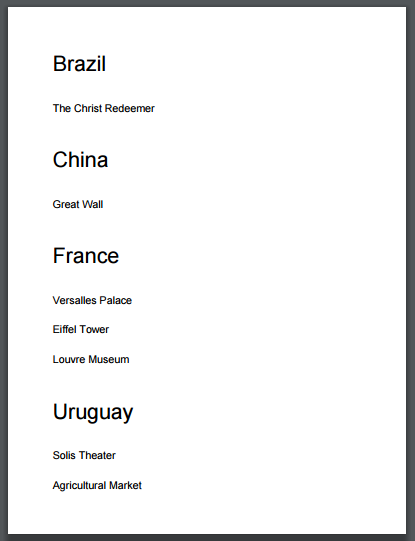
When you need to define small reports, like invoices or daily reports, this is the easiest way to do it. By creating a Procedure object with visual output, you can define a PDF Report.

Even though in each Procedure you define all the logic and the layout that makes up that report, you can decide to 'turn-on' the Customizable Layout property to allow the end-users to customize the layouts by using a simple tool. (Learn more about this possibility).
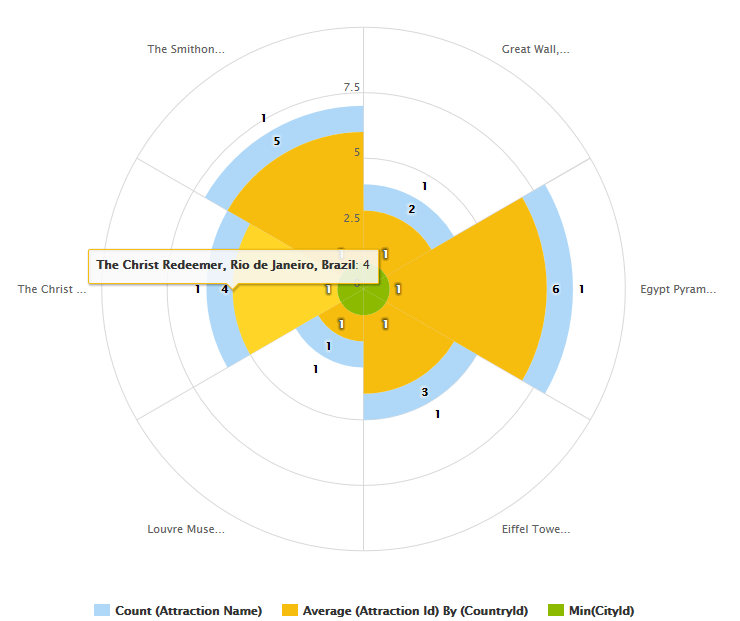
This is the type of report to use when you need to group the information by some specific characteristic, to get some visual perspective. Using the Query object and the QueryViewer control you can create more dynamic and visual reports, which allows you to directly manipulate the reports, leading you to a better comprehension of the information. For instance, if you are trying to make decisions about your sales department you will need to have the information in some visual way that you can make the best choice for your company.

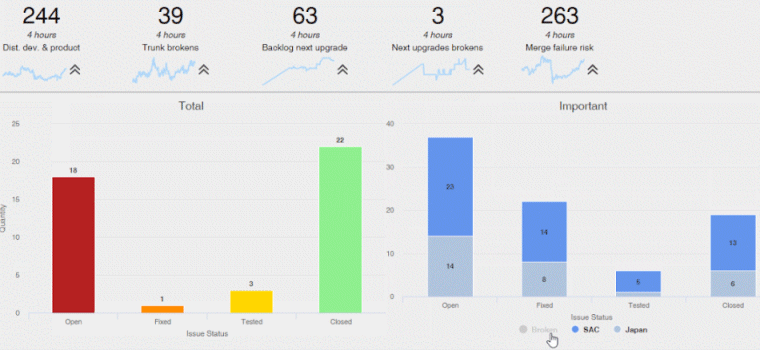
Dashboards provide at-a-glance views of KPIs (key performance indicators) relevant to a particular objective or business process. Often, the "dashboard" is displayed on a web page that is linked to a database which allows the report to be regularly updated. More information at Dashboard object

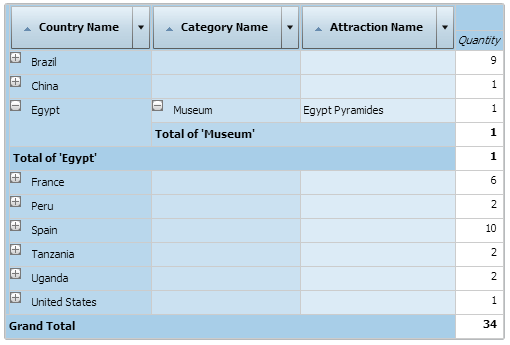
Increasingly over time users, who may not have programming skills, need to gain access to the business data on our company. GXquery 4.0, the GeneXus reporting tool, allows us to view and analyze our business data with a practical “drag & drop” system of filters and variables with which you will be able to obtain the data we need in order to make your best decisions. For more information see http://www.gxquery.com.
