In the GeneXus IDE you can debug GeneXus code, such as with other development environments (Visual Studio, NetBeans, etc.).
To debug the application, you have to add a breakpoint and run the application. When the breakpoint is found, GeneXus gets the focus, and you can check attribute and variable values using the "Watch" tool window. In addition, the "Call Stack" window shows you the objects executed from the beginning of the execution.
Follow the basic steps to debug your code:
- Go to the Toolbar and select the Debug configuration, as shown in the image:
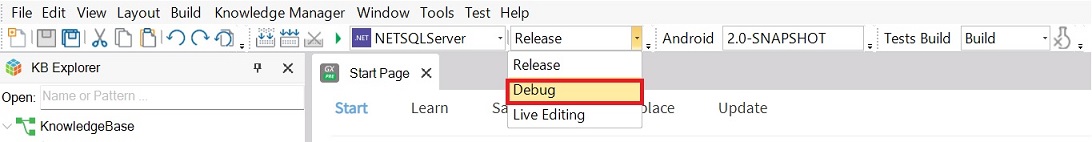
Once you have to select Debug, a pop-up window opens with the following options:
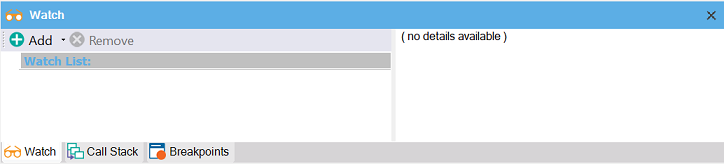
- Watch: Allows to visualize the values of variables and attributes at each step of the running process.
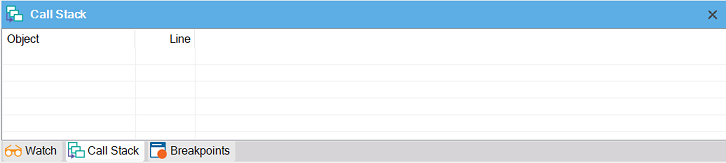
- Call Stack: Shows the object and the execution lines.
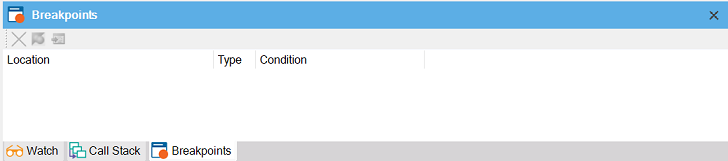
- Breakpoints: Displays the objects and lines of code where breakpoints have been added. It also allows you to activate, deactivate, delete, and navigate to where they are defined.
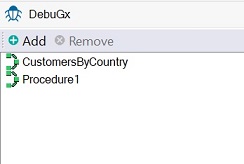
In addition, the debug tool window (DebuGx) will open.
- Add objects you want to debug to the debug tool window by clicking on Add and selecting the objects to debug in the pop-up window:
- Open an object added to the debug tool window and set a breakpoint on the line of code you need to review. To do this, you can right-click on the line and select Toggle Breakpoint.
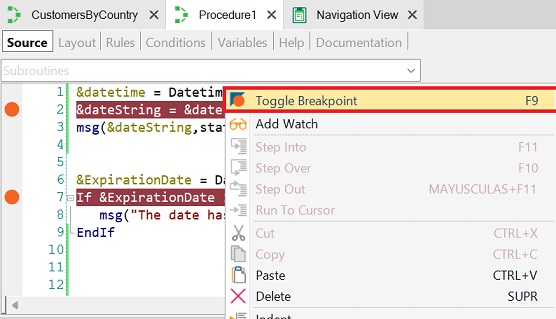
Note: Step 2 is not mandatory. You can add the breakpoint in the object's line you want, and it automatically added this object to the debug tool window.
- Go to the Watch Window and use the Add button to add the variables and attributes for which you want to know the value.
- Run the application by pressing F5.
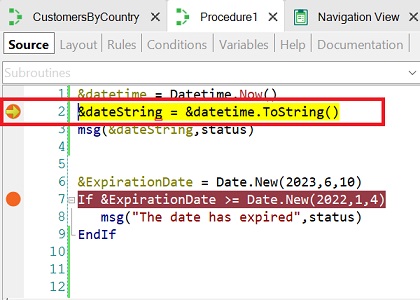
During execution, upon encountering a breakpoint, GeneXus will stop its execution and take the focus.
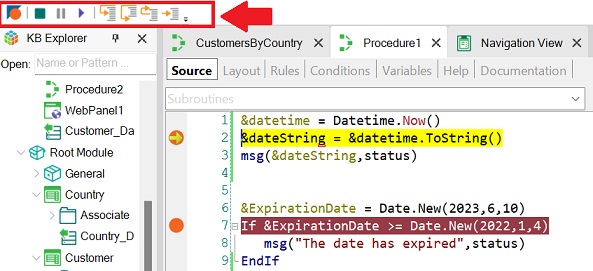
- Use the Debug toolbar to run, step by step. To do this, right-click anywhere on the Toolbar and select Debug.
In the following video, you can see the example of the execution time.
Notes:
- Objects added to the debug tool window are generated again with debug information.
- Objects generated with Debug information execute slower. In case of extreme performance degradation, see SAC #39137.
- Notice that the release code will be generated after rebuilding using the 'Release' configuration option.
- The debugger works with Server Side Code.
- Please review GeneXus Debugger and Profiling common issues, for troubleshooting.
Object: Procedure, Web Panel, Data Provider
Generator: Java, .NET, .NET Framework
Level: Back end
Code Coverage and Profiling
Live Editing in Web Applications
HowTo: Enable logging for Native Mobile