This document is focused on reducing CLS scores when loading Angular applications. To this end, it must be taken into account that many factors can cause high CLS scores when loading an application, and that other factors may exist besides those indicated in this document.
Some of the improvement patterns that will be mentioned in this document were applied to a real case— Sample PlantCare. This allowed for the reduction of CLS scores in Web Layouts simply by adjusting some properties in UI controls.
For more information, see Cumulative Layout Shift (CLS).
In the latest versions of Lighthouse (v8, v9), the score associated with CLS corresponds to 15% of what is described as the application Performance metric.
CLS varies in every screen of an application, and there may even be cases in which the same screen of an application presents different CLS values when loading. This is justified by the fact that the CLS score depends on many variables, such as the connection speed, the size of the data viewed on each screen, the type of content dynamically injected to the screen, the window resolution, the client browser's performance, and many other factors.
To calculate the CLS score of an application screen load, it is enough to run a Lighthouse report in the browser's DevTools, where the report is set as follows: Mode = Navigation (Default), Device = Mobile or Desktop and in Categories, the Performance checkbox is turned on.
For more information, see What Is Google Lighthouse and How to Use It?
Once the Lighthouse report is complete, it will show the CLS score of the application screen load according to Performance METRICS. If the screen has a CLS value above zero, the report on elements contributing to the CLS score will be displayed in the DIAGNOSTICS section, below the “Avoid large layout shifts” item.
This will provide an idea of the consequences of the CLS score on the application.
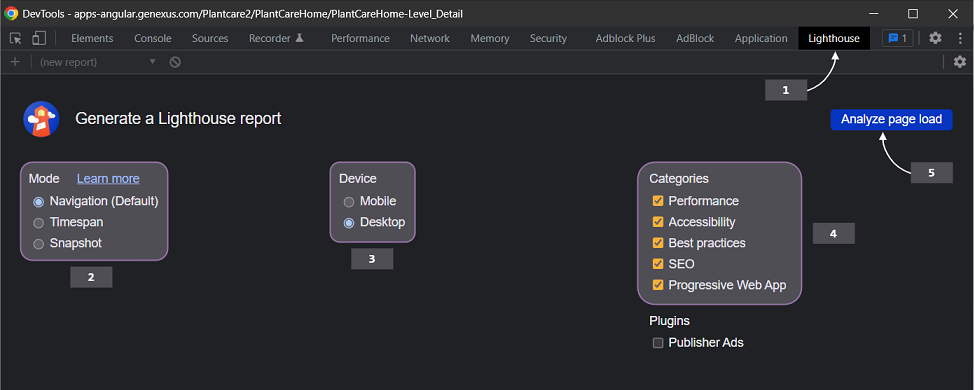
Figure 1: How to run the Lighthouse test in Chrome DevTools
Important: The Lighthouse report explains the consequences of the CLS value being above zero; it doesn’t have to determine the cause(s) of this value. In other words, the Lighthouse report can identify the elements that shift in the application load (and therefore increase the CLS value). However, the actual cause of this can be another element not mentioned in the report; for example, it can be an element that is on top and pushes the rest of the elements shown in the Lighthouse report. The latter is what happened with Sample PlantCare before it was updated to improve the CLS score. For an example, see the section titled Some cases in which this happened in Sample PlantCare.
When designing Layouts, even more so when they are designed with Tables, many times there are controls with a fixed height, such as 200dip. However, they are associated with a pd row size —in Angular, pd = 64px, or lower than the control height— in this case, less than 200dip. If the control has the Auto Grow property = True, when the Panel object is loaded, the control will push the entire content below it (in other words, the content will move unexpectedly), thus increasing the CLS level.
To solve this problem, if the size of the control is known in advance, simply adjust the row size of the control to match its height.
Similar cases can also occur when using controls inside Canvas containers.
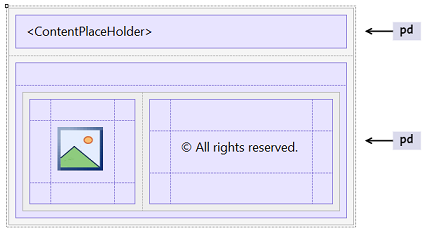
Case 1. In PlantCare, the MasterPanel is used to achieve a consistent Footer layout in all Panels. The MasterPanel that models this had the Rows Style property = pd;pd.
As a result, when loading the application —in this case, the ViewCategoryPage Panel— shifts occurred that increased the CLS level:
Since this is a Footer layout, it would be expected that the main content is 100% of the height, and the footer of the remaining size. Therefore, by setting Rows Style = 100%;pd on the main table, CLS scores are improved:
Note: This allowed going from a CLS score of 0.138 (Needs Improvement) to 0.008 (Good), which improved the Lighthouse Performance score.
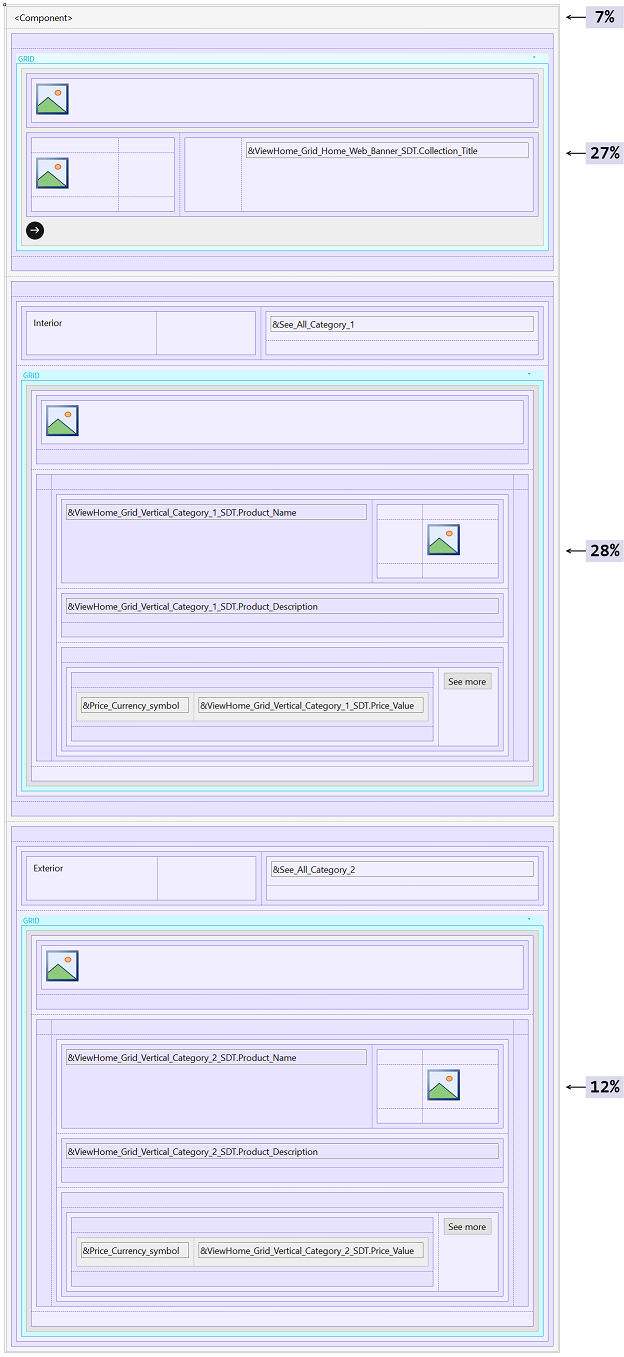
Case 2. In PlantCare, all Panels use a Component control to model a Header. This Component always has a fixed size that doesn't vary, and is placed in the first row of the main Table with Rows Style = 7%;27%;28%;12%
For this reason, when loading the application —in this case, the PlantCareHome Panel— these shifts were noticed which increased the CLS level:
In this comparison, the texts “Indoor,” “Outdoor,” and “See All” were pushed down.
Since the Component has a fixed height, it would be expected that its Auto Grow property = False, and that the first row of the main Table has the height of the Component. Therefore, by setting Rows Style = 138dip;27%;28%;12% in the main table and the Auto Grow property = False in the Component, the CLS is improved:
Note: This allowed going from a CLS level of 0.205 (Needs Improvement) to 0 (Good), which improved the Lighthouse Performance score.
When dynamic content of varying height is inserted above other content, the CLS level usually increases. See the following example, which shows a Table with a vertical Grid whose Auto Grow property = True, and certain content below the Grid.
Since the Grid has the Auto Grow property = True, when loading the application, the 'Some action' button will start in a certain position. After the Grid is loaded, the 'Some action' button will move according to the size of the Grid:
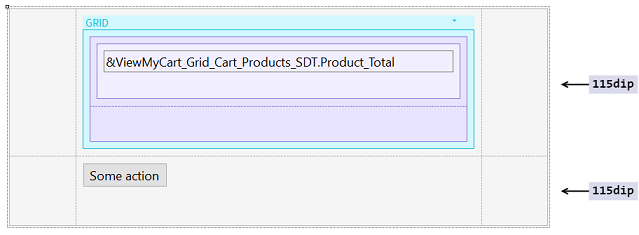
When there is certain content with a row of relative height above it, the CLS level usually increases because the row height can change depending on several factors. See the following example, showing a Table with Rows Style = 50%;115dip and Height = 100% in a column, and a vertical Grid with the Auto Grow property = True in another column.
When loading the application, the 'Some action' button will start in a certain position. However, since the left Table has a row with 50% height and the Grid has the Auto Grow property = True, when the Grid is loaded, the 'Some action' button will shift according to the 50% Grid size, because the row containing the 'Some content' TextBlock has grown:
If the application load includes animated controls where the Class property has width, height, top, right, bottom, and left CSS properties, among others, try to replace these animations with others that only use the CSS transform property because it doesn't involve design changes (furthermore, these animations will be more efficient).
Example:
- Instead of updating/changing the height and width properties, try using transform: scale().
- Instead of updating/changing the top, right, bottom, or left properties, try using transform: translate().