GeneXus collects telemetry data (traces, logs, and metrics) of its applications with OpenTelemetry.
This article explains the necessary steps to allow OpenTelemetry for your applications’ observability.
First, you have to configure your infrastructure to support observability, according to the Opentelemetry provider you will be using, and the Observability backend of your choice.
Next, follow the steps below.
1. Activate Observability in GeneXus.
In Observability Provider property, select the service provider.
3. Build any object.
4. Deploy/Run.
Note: In the case of Java applications, the deployment to Docker automatically packages all the requirements and sets the environment settings to start the Docker image and have the application observable without the need for any extra configuration.
If you are not using Docker containers, follow the instructions of
OpenTelemetry Java Automatic instrumentation. That is, download the
Java Agent and add -javaagent:path/to/opentelemetry-javaagent.jar and other config to your JVM startup arguments.
Standardizing log correlation with traces and metrics increases the value of observability.
This is OpenTelemetry’s collection of logs, traces, and metrics:
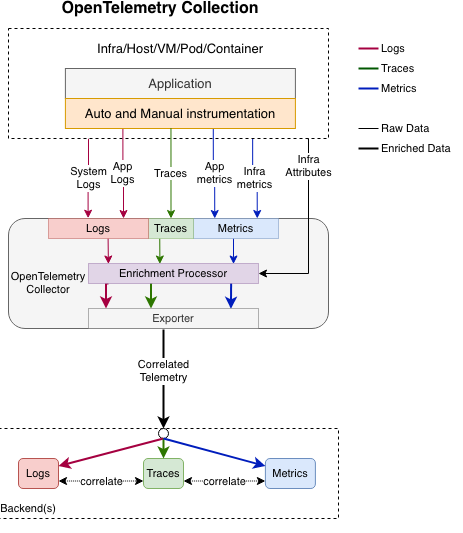
The connection between Logs and Traces is achieved by registering the trace_id in the Logs.
To achieve this with GeneXus Java Generator, you only need to set the Log Format property = JSON, and the Observability Provider property must take a value other than None.
Suppose you are working in a Java environment and you have configured the following properties:
Log Format property = JSON
Observability Provider property = Observability with AWS Distro for OpenTelemetry.
Then a Log showing this connection will look like this:
{
    "@timestamp": "2023-09-25T05:02:11.812Z",
    "ecs.version": "1.2.0",
    "log.level": "DEBUG",
    "message": "Hello, world!",
    "process.thread.name": "http-nio-8080-exec-165",
    "log.logger": "GeneXusUserLog.GBrain.Middleware.Utils.ResponseExtractText",
    "AWS-XRAY-TRACE-ID": "1-65111441-4939baba8728c6453e80769f@a6ad1d8bfe037e4f",
    "span_id": "a6ad1d8bfe037e4f",
    "trace_flags": "01",
    "trace_id": "651114414939baba8728c6453e80769f"
}
Azure Monitor Sample
Opentelemetry Sample
AWS Distro sample