This is just one possible scenario you can set up to test Observability in .NET.
In this case, containers are used to easily test a .NET application using OpenTelemetry (OTEL).
Prometheus will be used to analyze Metrics and Tempo (distributed tracing backend) to watch Traces, all in Grafana running in a Docker container.
Summary
You only need the following requirement on your local machine:
The GeneXus web application is generated using GeneXus 18 Upgrade 8 (which uses .NET 8).
First, configure the Observability Provider property with the "OpenTelemetry" value and do a Build with this only of any object. This generates the CloudServices.config file with the following contents to have the generated application use the Opentelemetry SDK.
 <Service>
    <Name>OPENTELEMETRY</Name>
    <Type>Observability</Type>
    <ClassName>GeneXus.OpenTelemetry.OpenTelemetry.OpenTelemetryProvider, GeneXus.OpenTelemetry, Version=1.0.0.0, Culture=neutral, PublicKeyToken=null</ClassName>
    <Properties />
  </Service>
From GeneXus' side, that's all you need to do.
Below is a step-by-step guide to set up the local environment
1. Deploy your application to Docker.
This packages your application and builds a Docker image, leaving it ready to be run when needed.
The context folder of your deployment folder has this structure. Note that it has the dockerfile and a temp folder with your binaries and all the resources needed to run your app.
2. Copy the following files to the context folder (where the dockerfile is located).
- docker-compose.yaml
Compose a file that loads the services: otel-collector, tempo, prometheus, grafana, and your application service. You can download the file here.
Note that this file has an entry like the following.
This is the definition of your web application, which has its dockerfile located in the context directory.
Here you can define the environment variables.
# Sample application
  otelsampleapp:
    build:
      context: .
    environment:
      - OTEL_EXPORTER_OTLP_ENDPOINT=http://otel-collector:4317
      - OTEL_RESOURCE_ATTRIBUTES=service.namespace=GeneXus,service.name=sample-app,service.version=1.0.1
      - OTEL_METRICS_EXPORTER=otlp
      - OTEL_TRACES_EXPORTER=otlp
      - OTEL_LOGS_EXPORTER=otlp,logging
      - GX_LOG_OUTPUT=ConsoleAppender
      - ASPNETCORE_URLS=http://*:8080
    ports:
      - "9999:8080"
The ASPNETCORE_URLS environment variable is necessary for .NET 8 applications. In this case, the default port where the application will be running at the container is 8080.
"ports" indicates the port mapping. Your app can be accessed locally at port 9999.
For more information on OTEL environment variables, click here.
- grafana-datasources.yaml
The file has the following contents:
apiVersion: 1

datasources:
- name: Prometheus
  type: prometheus
  uid: prometheus
  access: proxy
  orgId: 1
  url: http://prometheus:9090
  basicAuth: false
  isDefault: true
  version: 1
  editable: false
  jsonData:
    httpMethod: GET
    exemplarTraceIdDestinations:
    - name: trace_id
      datasourceUid: Tempo
- name: Tempo
  type: tempo
  access: proxy
  orgId: 1
  url: http://tempo:3200
  basicAuth: false
  isDefault: false
  version: 1
  editable: false
  apiVersion: 1
  uid: tempo
  jsonData:
    httpMethod: GET
    serviceMap:
      datasourceUid: prometheus
- otel-collector.yaml
Here we configure the OpenTelemetry collector. The file has the following contents.
-
prometheus.yaml
This is the configuration of Prometheus. Download it from here.
-
tempo.yaml
This is the configuration of Tempo.
server:
  http_listen_port: 3200

distributor:
  receivers:
    otlp:
      protocols:
        http:
        grpc:

storage:
  trace:
    backend: local
    wal:
      path: /tmp/tempo/wal
    local:
      path: /tmp/tempo/blocks
First, run the docker-compose command to create and start the container.
Open a terminal in the context folder and run:
- docker-compose up -d
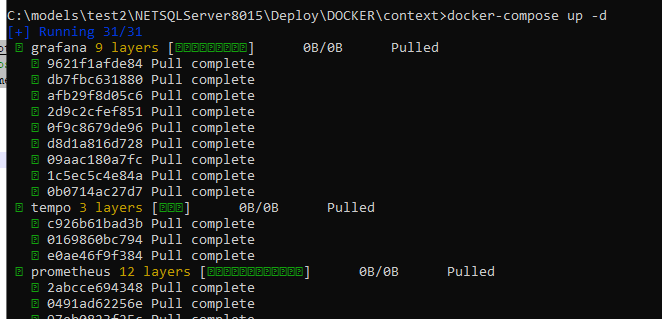
This pulls all the required images and creates a container with all of them.
You can see the created container using Docker desktop.
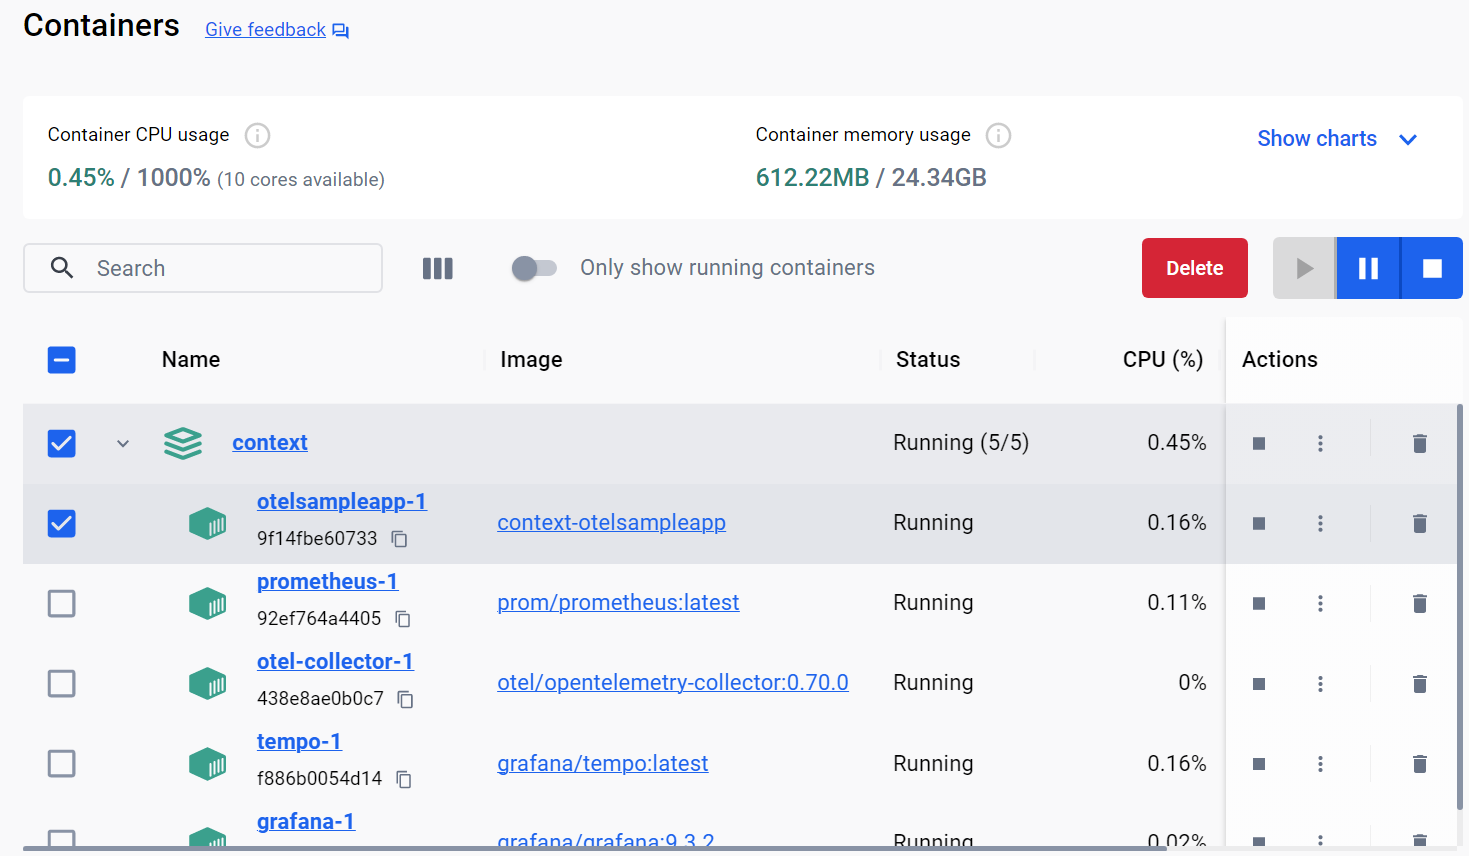
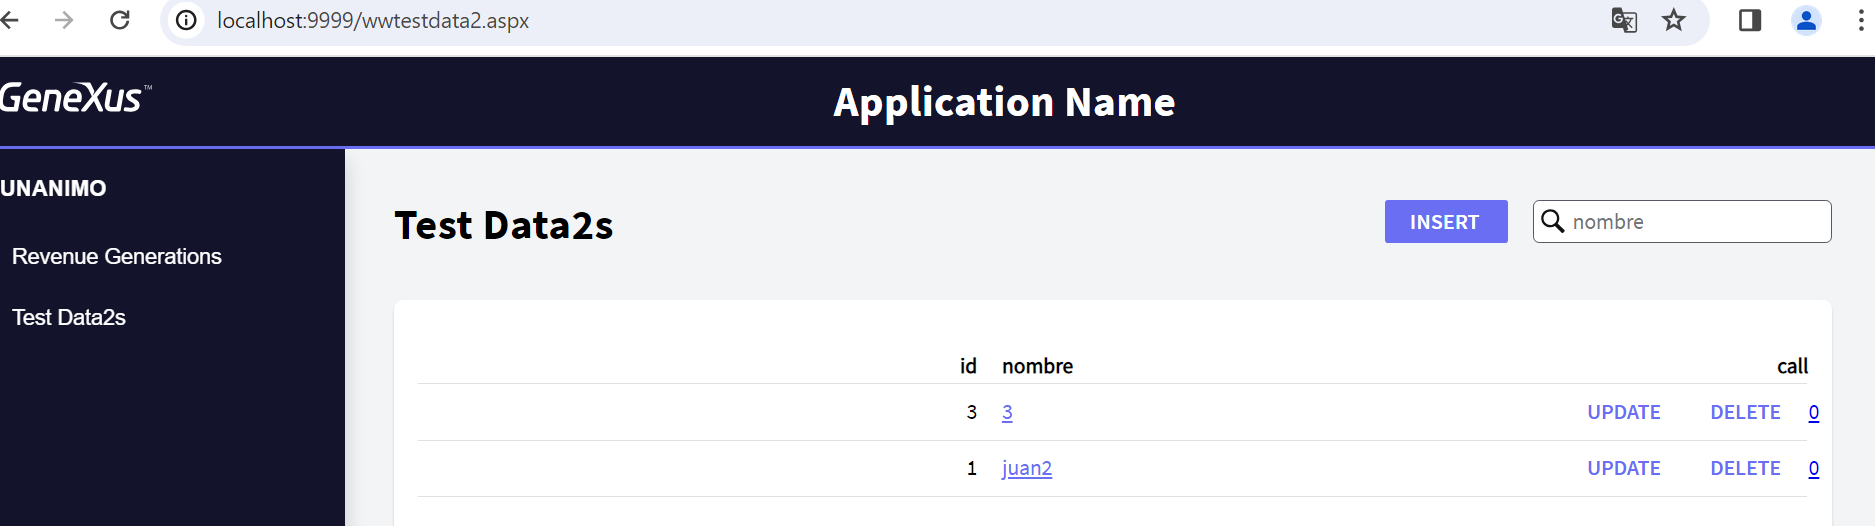
In this case, the sample app runs on the local port 9999.
Since in this example your main object is wwtestdata2, you can access the application at: http://localhost:9999/wwtestdata2.aspx
You may use the following Powershell script to generate a load to the application.
while($true)
{
    Invoke-WebRequest http://localhost:9999/wwtestdata2.aspx
    Start-Sleep -Milliseconds 500
}
The application sends metrics and traces to the OTel Collector, which exports metrics and traces to Prometheus and Tempo, respectively.
Wait for 2 minutes while running tests before analyzing the data, so that enough data is generated and exported.
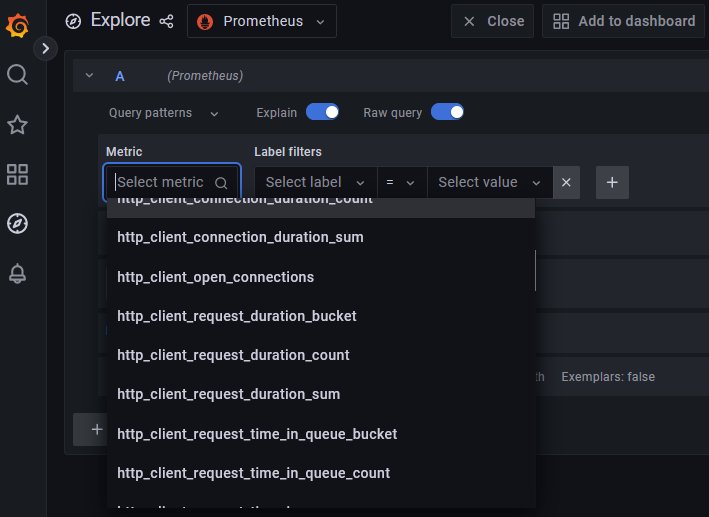
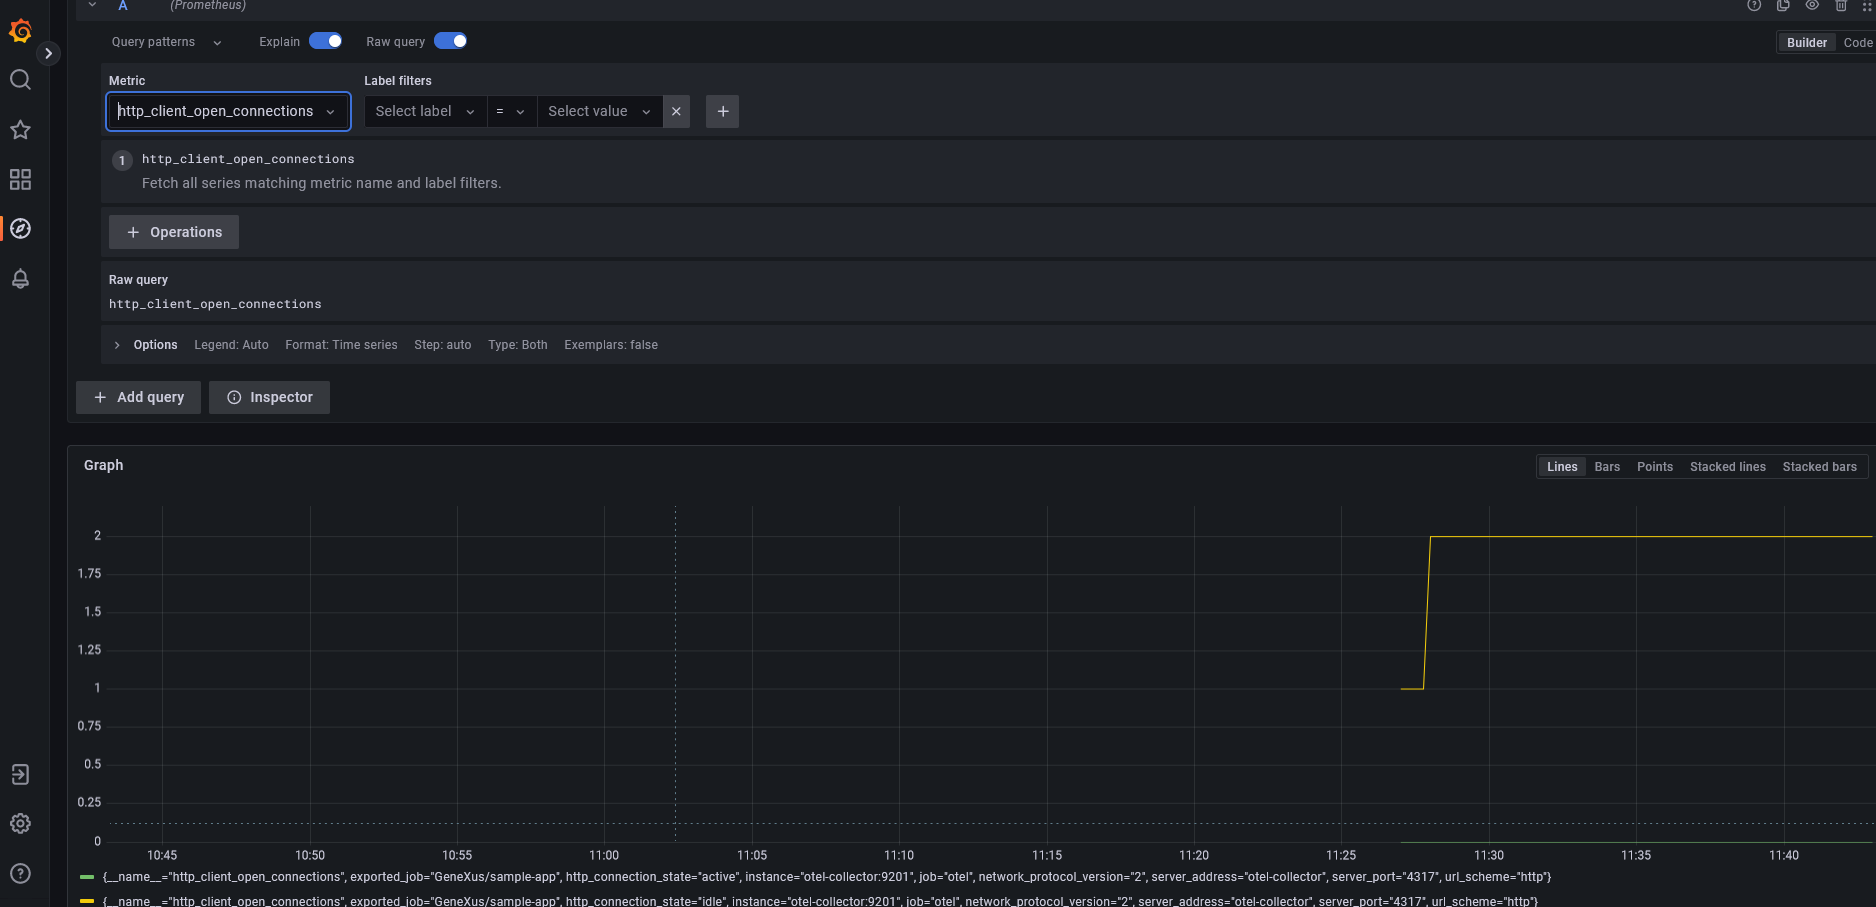
Open Grafana (http://localhost:3000), select Explore and select Prometheus as the source.
There you have a "Metric" combo box with all the available metrics to view.
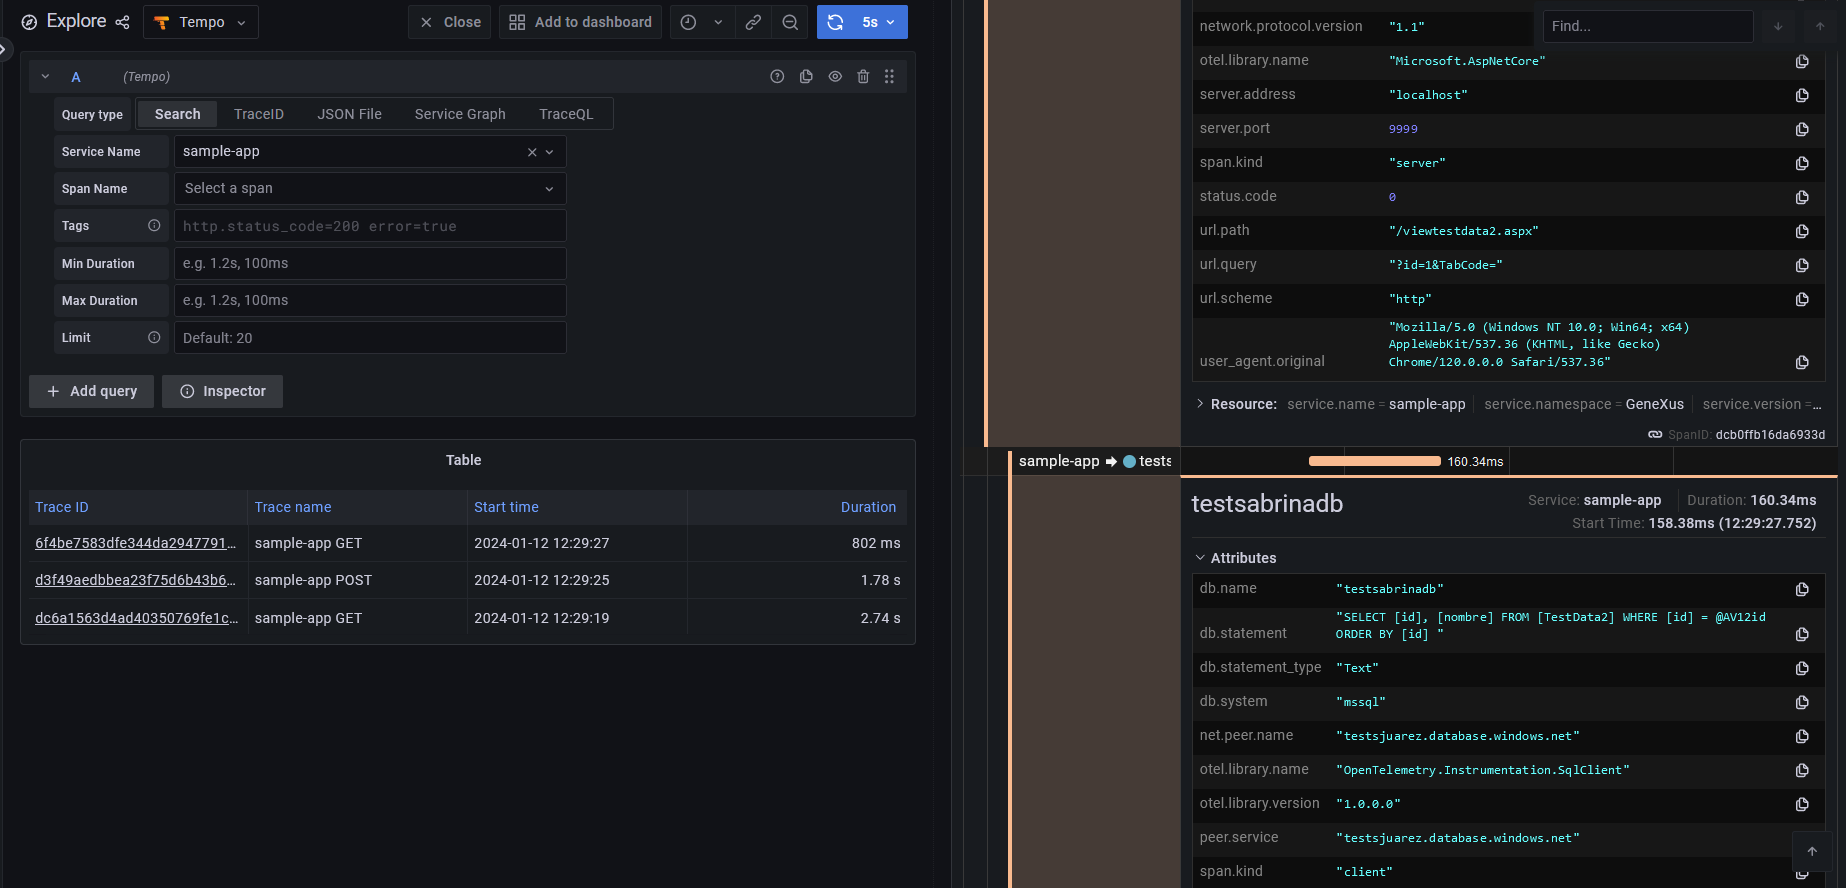
Using Tempo datasource you can view the traces generated by OpenTelemetry.
Tip: The following command line is useful for troubleshooting when a container fails to start:
docker logs <container_id> -f