This is one possible scenario you can set up to test Observability (Traces and Metrics) using AWS X-Ray and AWS CloudWatch for a .NET application.
In this case, the Observability Provider property is set to AWS Distro for Opentelemetry (ADOT).
Start by noting that, by setting this property, GeneXus generates your .NET application to be instrumented using OpenTelemetry SDK enabled for use with X-Ray.
You only need to setup the AWS OpenTelemetry (ADOT) Collector to have the whole system working.
In this sample case, containers are used to easily test the application, using AWS credentials for connecting to AWS services.
If you haven't set up your AWS Credential profile yet, please follow the instructions for setting up your AWS credentials. They are required to connect to Amazon services.
For detailed information on other scenarios (such as using AWS ECS, AWS EC2, EKS, AWS AppRunner, on-premises), please refer to the AWS corresponding documentation.
Summary
You only need the following requirement on your local machine:
The GeneXus web application is generated using GeneXus 18 Upgrade 8 (which uses .NET 8).
First, configure the Observability Provider property with the "AWS Distro for Opentelemetry" value and do a Build with this only for any object. This generates the CloudServices.config file with the following contents. To have the generated application use the Opentelemetry SDK.
 <Service>
    <Name>AWSOTEL</Name>
    <Type>Observability</Type>
    <ClassName>GeneXus.OpenTelemetry.AWS.AWSOtelProvider, GeneXus.OpenTelemetry.AWS.AspNet, Version=1.0.0.0, Culture=neutral, PublicKeyToken=null</ClassName>
    <Properties />
  </Service>
From GeneXus' side, that's all you need to do.
Below is a step-by-step guide to set up the local environment:
1. Deploy you application to Docker
This packages your application and builds a Docker image, leaving it ready to be run when needed.
The context folder of your deployment folder has this structure. Note that it has the dockerfile and a temp folder with your binaries and all the resources needed to run your app.
2. Copy the following files to the context folder (where the dockerfile is located).
Compose a file that loads the services: ADOT Collector, and your application service. You can download the file here.
Note that this file has an entry like the following:
This is the definition of your web application, which has its dockerfile located in the context directory.
Here, you can define the environment variables.
otelsampleapp:
    build:
      context: .
    environment:

      - OTEL_EXPORTER_OTLP_ENDPOINT=http://aws-ot-collector:4317
      - OTEL_RESOURCE_ATTRIBUTES=service.namespace=GeneXus,service.name=sampleGX
      - AWS_REGION=us-east-1
      - OTEL_METRICS_EXPORTER=otlp
      - OTEL_TRACES_EXPORTER=otlp
      - OTEL_LOGS_EXPORTER=otlp
      - GX_LOG_LEVEL=debug
      - ASPNETCORE_URLS=http://*:8080
    ports:
      - "9999:8080"
    depends_on:
      - aws-ot-collector
The ASPNETCORE_URLS environment variable is necessary for .NET 8 applications. In this case, the default port where the application will be running at the container is 8080.
"ports" indicates the port mapping. Your app can be accessed locally at port 9999.
For more information on OTEL environment variables, click here.
The ADOT collector has to be added to the docker-compose file as shown.
Note that you should add your AWS credentials, or otherwise, your AWS_PROFILE.
The AWS Region should also be modified as required.
 # ADOT Collector
  aws-ot-collector:
    image: public.ecr.aws/aws-observability/aws-otel-collector:latest
    command: ["--config=/etc/otel-agent-config.yaml"]
    environment:
      - AWS_REGION=us-east-1
      - AWS_ACCESS_KEY_ID=<Here your Access Key>
      - AWS_SECRET_ACCESS_KEY=<Here your Secret Access Key>
    volumes:
      - ./config-test.yaml:/etc/otel-agent-config.yaml
      - ~/.aws:/home/aoc/.aws
    ports:
      - "1777:1777"   # pprof extension
      - "55680:55680" # zpages extension
      - "13133"       # health_check
- config-test.yaml
It defines the receivers, and exporters (awsxray for traces, awsemf for metrics). Download it here.
First, run the docker-compose command to create and start the container.
Open a terminal in the context folder and run:
- docker-compose up -d
This pulls all the required images and creates a container with all of them.
You can see the created container using Docker desktop.
In this case, the sample app runs on the local port 9999.
Since, in this example, your main object is wwtestdata2, you can access the application at: http://localhost:9999/wwtestdata2.aspx
After executing the application, you can go to the AWS console and see the telemetry data emitted by your application.
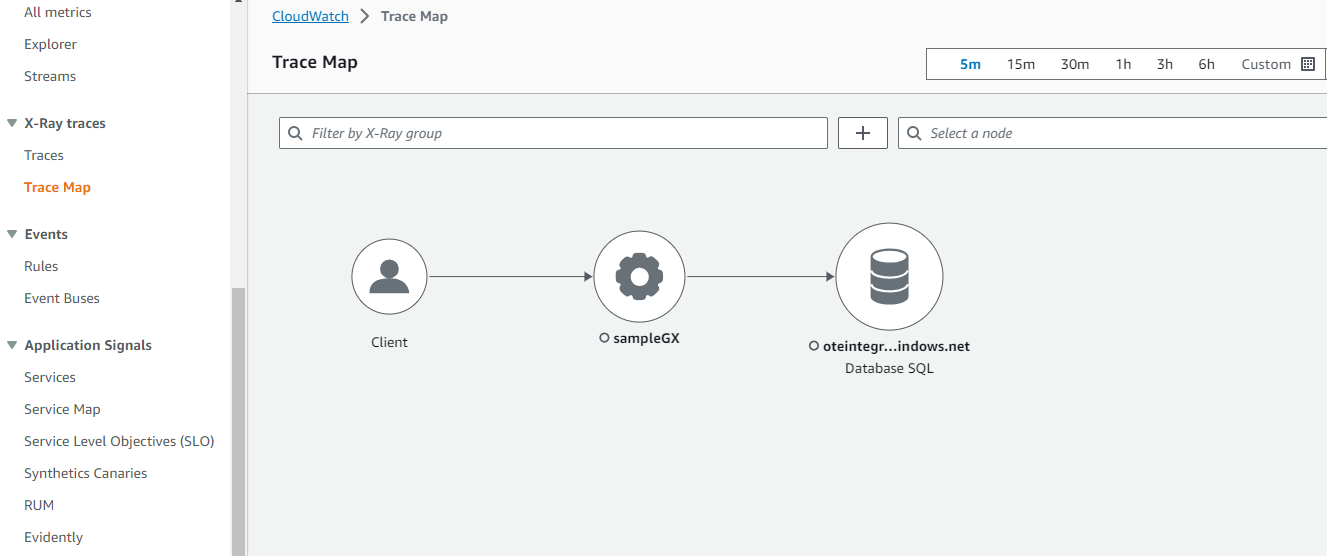
You will see that a Logging Group is created using the service.name that you established for your service (in this example: "sampleGX").
The following is the Trace Map under X-Ray Traces menu option.
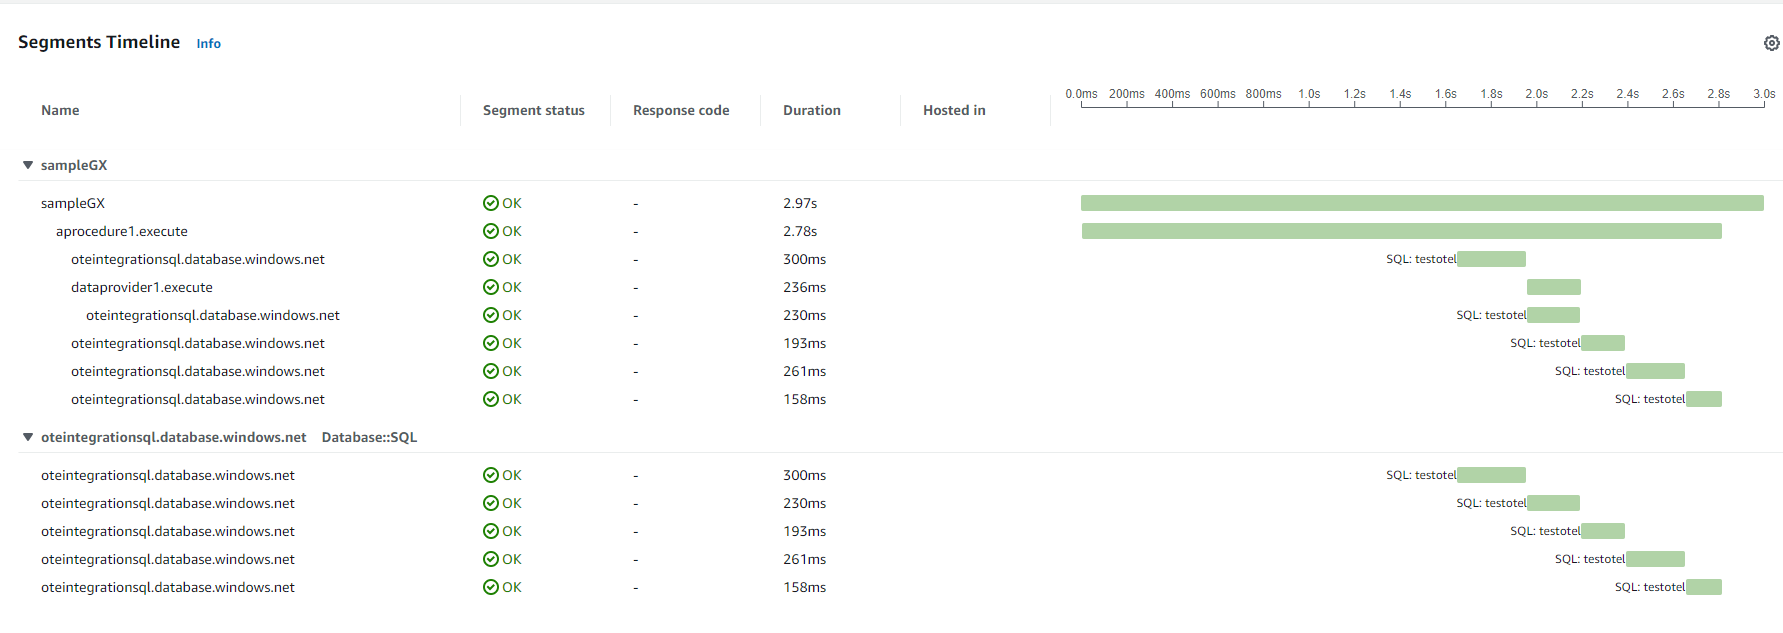
This is a view of a Trace and its Spans:
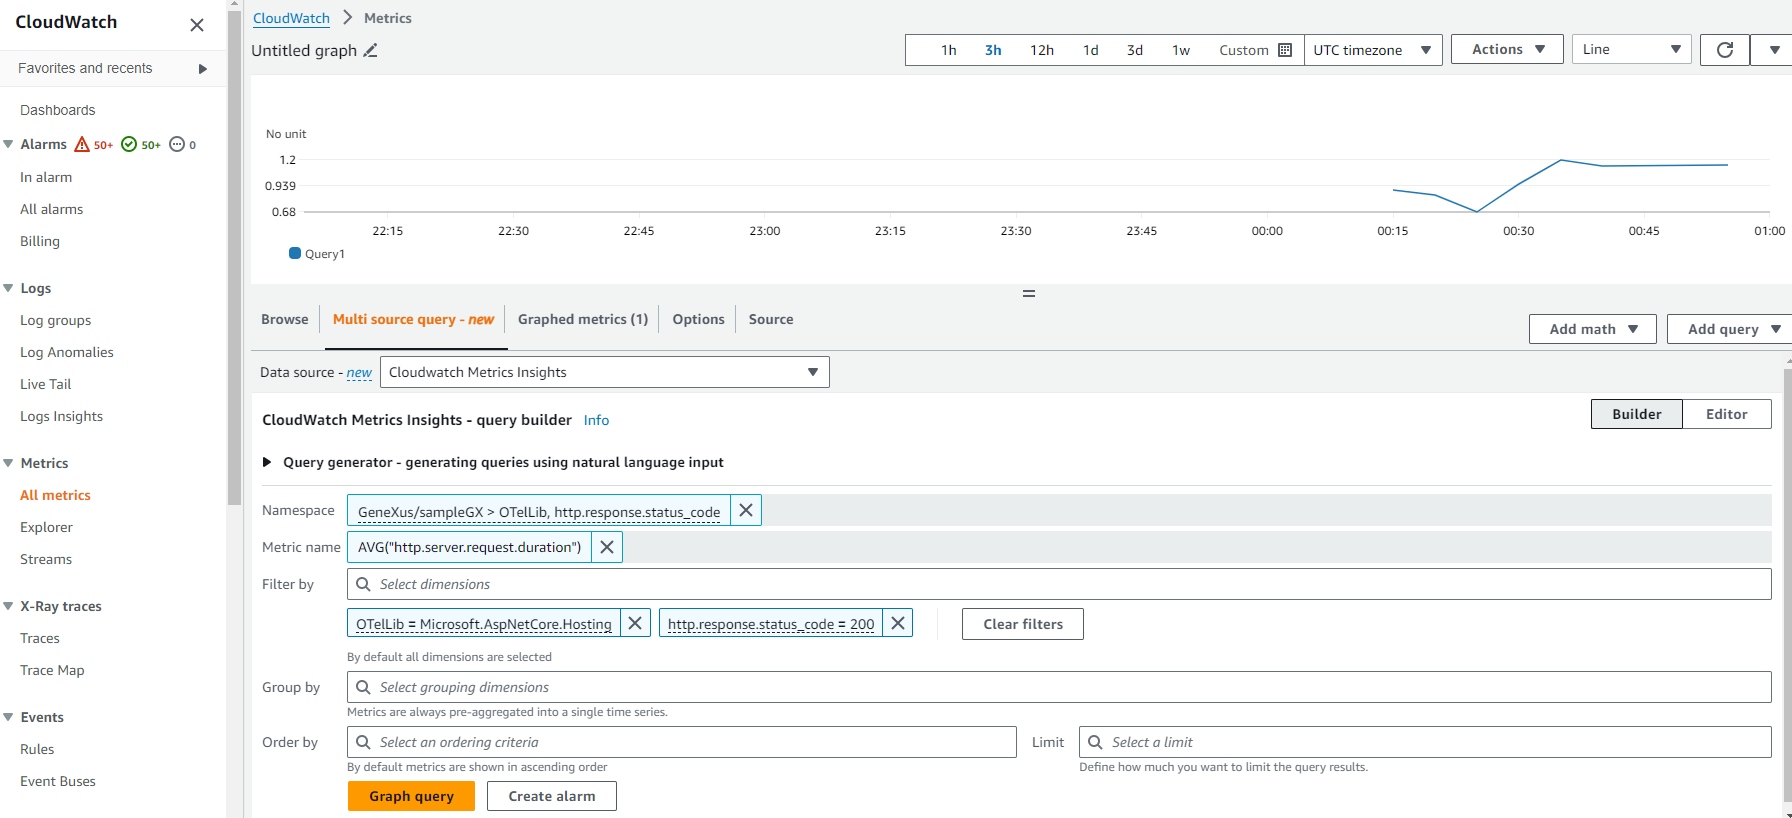
The following is a view of some Metrics:
Observability with AWS Distro for OpenTelemetry
CloudWatch EMF Exporter (awsemf)
Configuring permissions