The following is a sample scenario using the SigNoz Observability back end.
In this case, containers are used to easily test a .NET application using OpenTelemetry (OTel).
This is just one possible scenario you can set up to test Observability in .NET.
According to the documentation, there are two ways to send data to SigNoz Cloud:
- Send traces directly to SigNoz Cloud
- Send traces via OTel Collector (recommended)
In this document, the second option is used.
Summary
You only need the following requirements on your local machine:
The GeneXus web application is generated using GeneXus 18 Upgrade 9.
First, configure the Observability Provider property with the "OpenTelemetry" value and do a Build with this only of any object.
From GeneXus' side, that's all you need to do.
Below is a step-by-step guide to set up the local environment:
1. Deploy your application to Docker.
This packages your application and builds a Docker image, leaving it ready to be run when needed.
The context folder of your deployment folder has this structure. Note that it has the dockerfile and a temp folder with your binaries and all the resources needed to run your app.
2. Copy the following files to the context folder (where the dockerfile is located).
version: "3"
services:

  # OTEL Collector to receive logs, metrics and traces from the application
  otel-collector:
    image: otel/opentelemetry-collector:latest
    command: [ "--config=/etc/otel-collector.yaml" ]
    volumes:
      - ./otel-collector.yaml:/etc/otel-collector.yaml
    ports:
      - "4317:4317"
      - "4318:4318"
      - "9201:9201"

# Sample application
  otelsampleapp:
    build:
      context: .
    environment:
      - OTEL_EXPORTER_OTLP_PROTOCOL=grpc
      - OTEL_EXPORTER_OTLP_ENDPOINT=http://otel-collector:4317
      - OTEL_RESOURCE_ATTRIBUTES=service.namespace=GeneXus,service.name=sample-app,service.version=1.0.1
      - OTEL_METRICS_EXPORTER=otlp
      - OTEL_TRACES_EXPORTER=otlp
      - OTEL_LOGS_EXPORTER=otlp,logging
      - GX_LOG_LEVEL=debug
      - ASPNETCORE_URLS=http://*:8080

    ports:
      - "9999:8080"
Note that this file has an entry called otelsampleapp.
This is the definition of your web application, which has its dockerfile located in the context directory.
There you define the necessary environment variables.
The file has the following contents:
receivers:
  otlp:
    protocols:
      grpc:
      http:

processors:
  batch:

exporters:
  debug:
    verbosity: detailed
  otlp:
    endpoint: "ingest.{your_region}.signoz.cloud:443"
    tls:
      insecure: false
    headers:
      "signoz-access-token": <your_access_token>

service:
  pipelines:

    traces:
      receivers: [otlp]
      processors: [batch]
      exporters: [otlp]
    metrics:
      receivers: [otlp]
      processors: [batch]
      exporters: [otlp]
    logs:
      receivers: [otlp]
      processors: [batch]
      exporters: [otlp]
The access token can be found in the Settings pane of SigNoz UI.
For more information on the configuration of the OTel Collector, see here.
First, run the docker-compose command to create and start the container.
Open a terminal in the context folder and run:
- docker-compose up -d
You can see the created container using Docker desktop.
Run the application to generate some traffic.
In the SigNoz account, open the Services tab. Click on the Refresh button on the top right corner, and your application should appear in the list of Applications.
You might have to wait for a few seconds before the data appears on SigNoz UI.
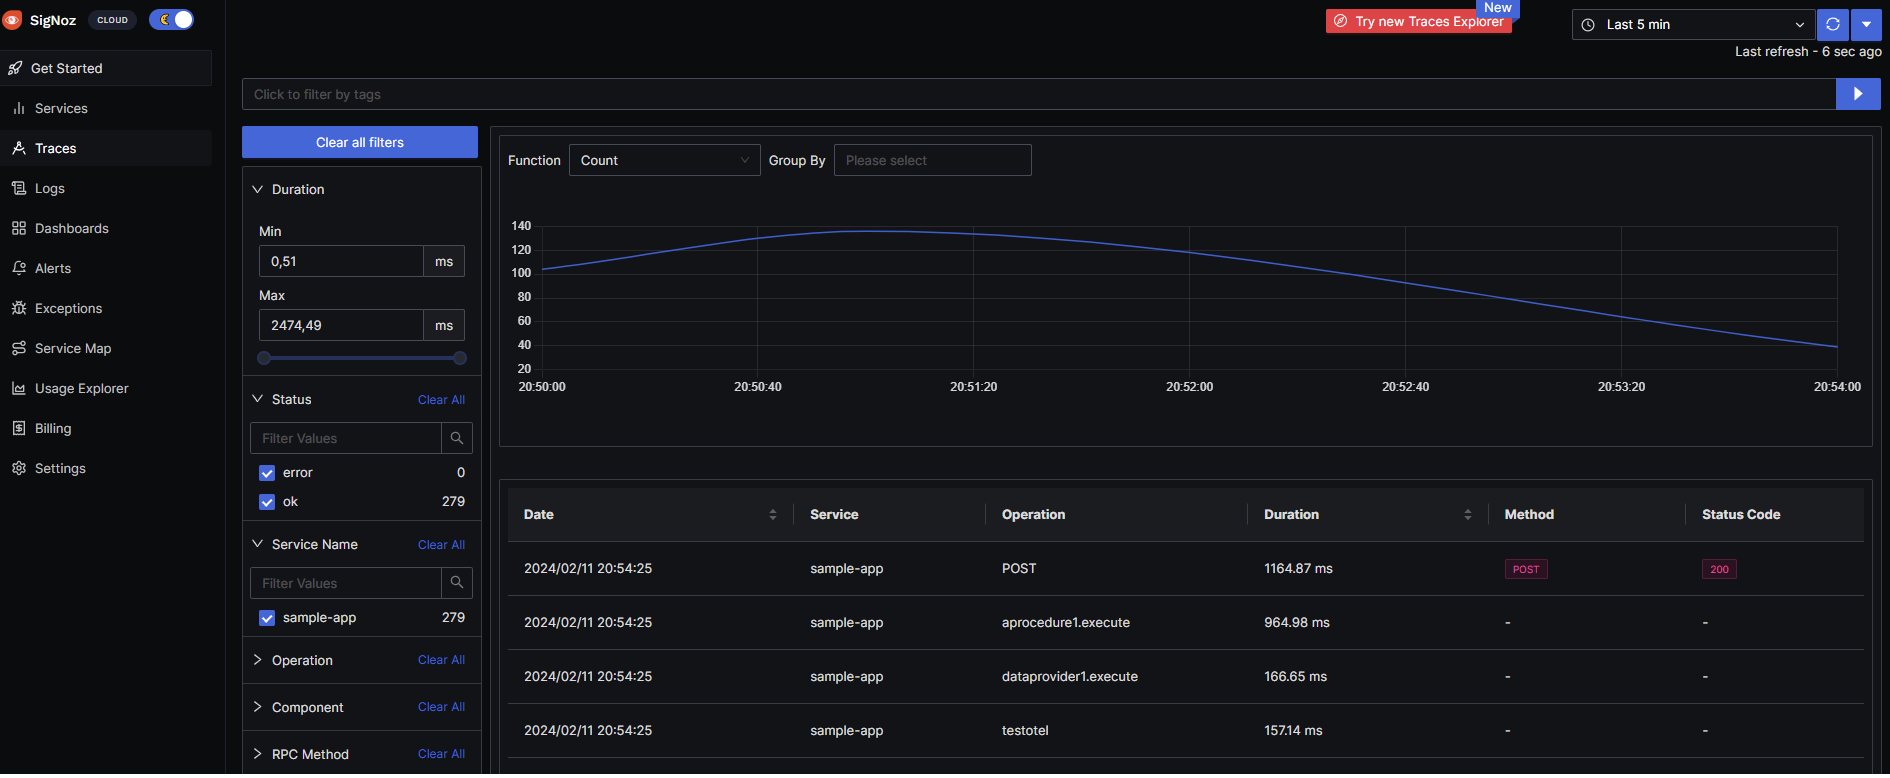
You can see the Traces of your application at the Traces pane:
The following are the details of a selected Trace:
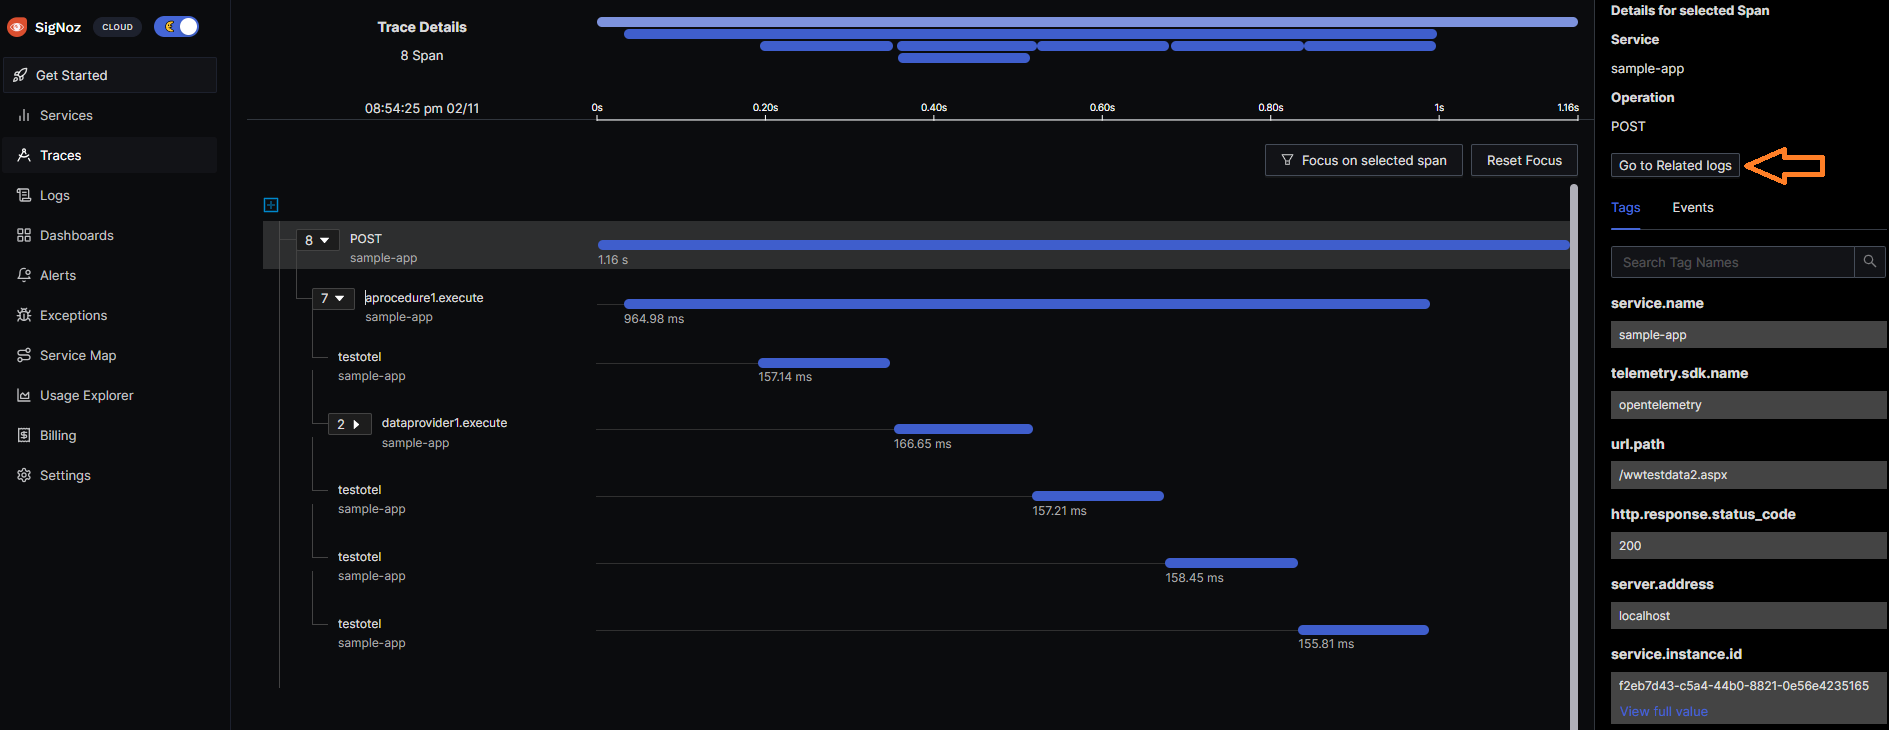
The log correlation with other telemetry signals such as Traces is an important feature of OpenTelemetry.
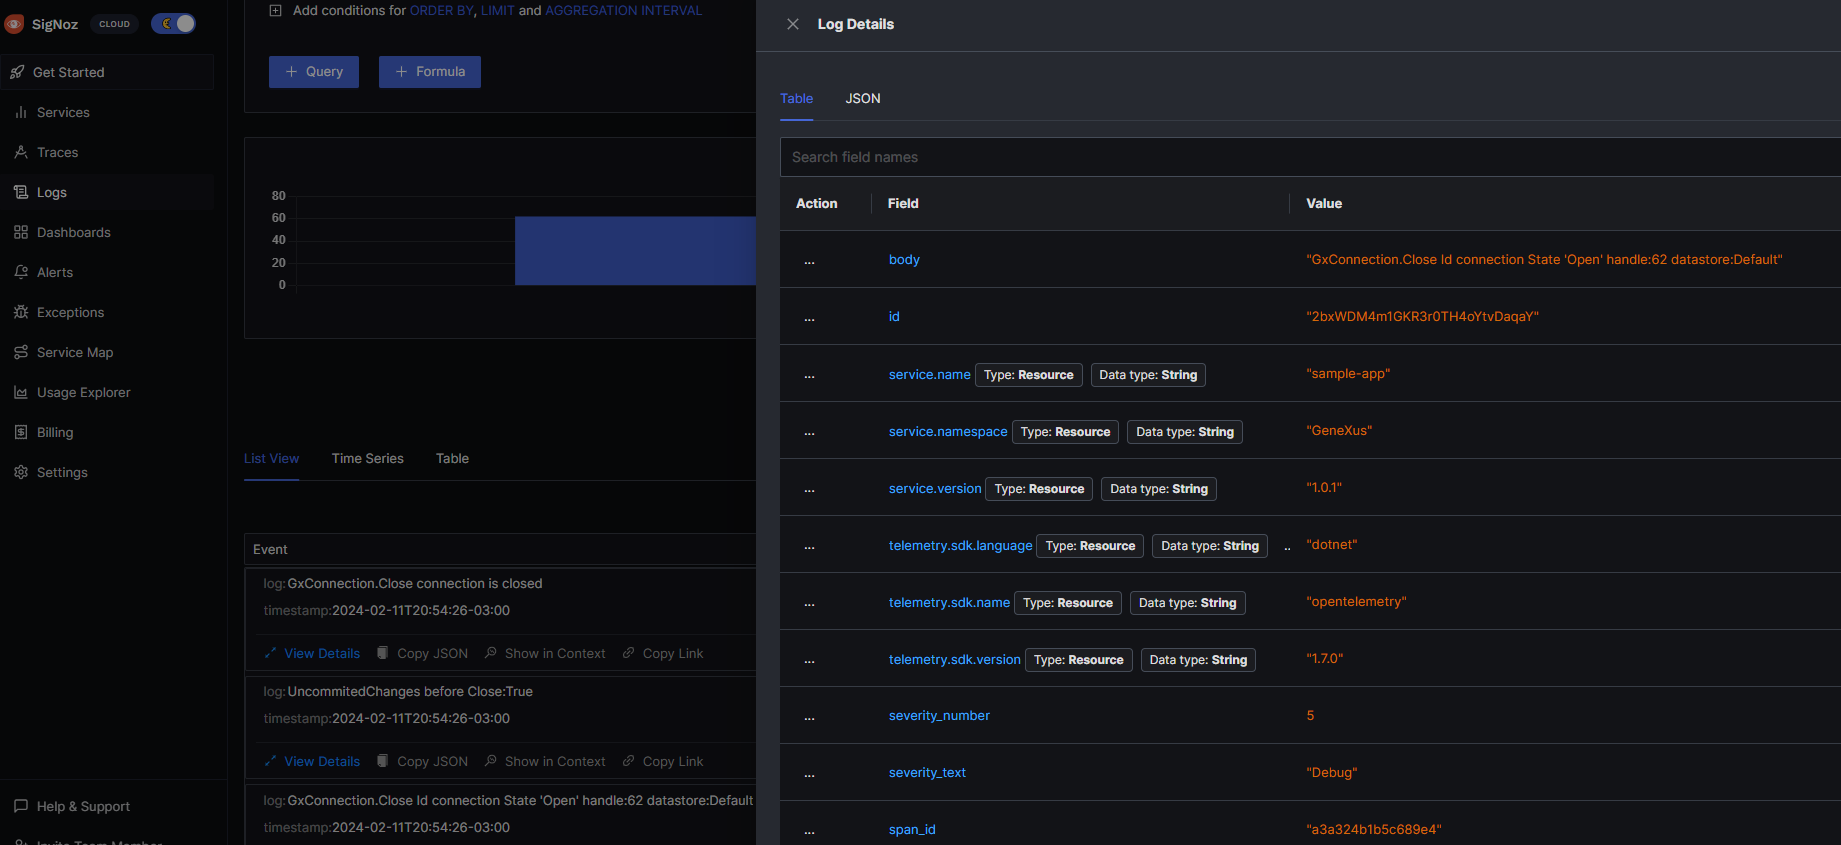
You can click on "Related Logs" and see the logs of the application (.NET standard classes logs and logs using the Log external object), filtered by the Trace_Id.
If you configure the debug exporter like this:
debug:

  verbosity: detailed
There is debug information for the execution and to detect any misconfigurations or errors.
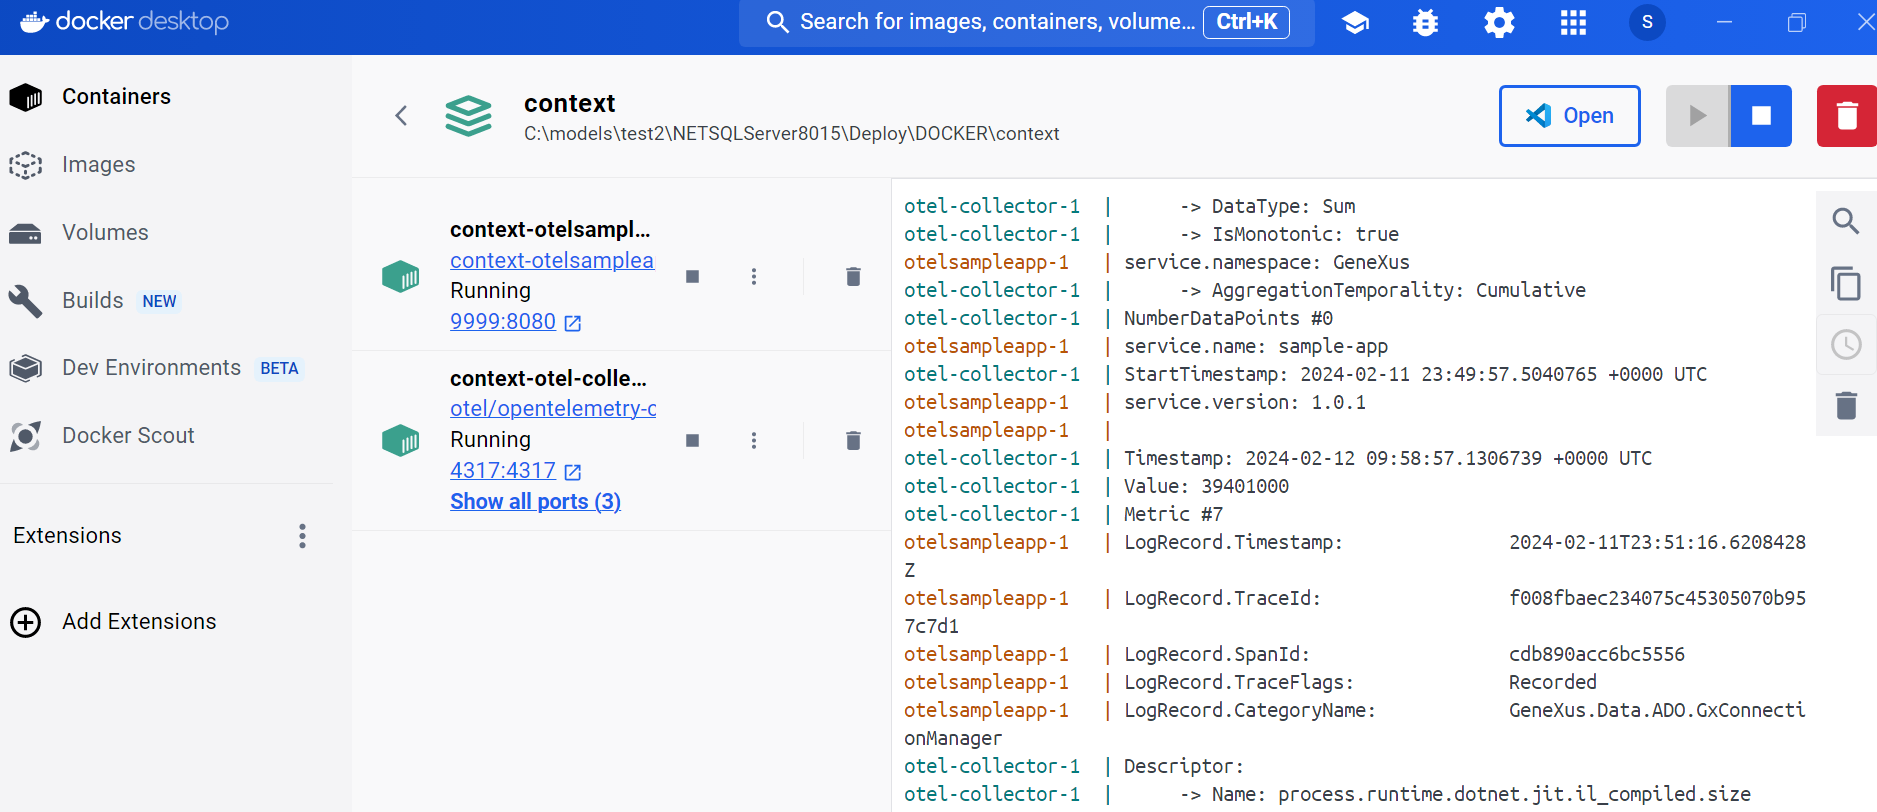
Besides, by configuring the logging exporter for LOGS, you have the logging telemetry data at the std output.
OTEL_LOGS_EXPORTER=otlp,logging
Since GeneXus 18 Upgrade 8