The objective is to be able to centralize monitoring using Java Management Extensions (JMX) in the same backend where the Observability data (Metrics) is displayed.
For JMX there is a solution by OpenTelemetry: JMX Gatherer and JMX Receiver.
To use it, follow the steps below:
1. Build your Java application with the Enable Management property set to TRUE.
This is to register the MBeans of the standard Java classes (com.genexus.management and com.genexus.performance packages).
See Management and Performance information using JMX for more information on the MBeans exposed by GeneXus Java applications.
The application used for this sample is a command line procedure that takes a while to run.
2. Make a local deployment of the application using the Application Deployment tool.
Next, execute the following in the console (positioned in the deploy directory):
java -Dcom.sun.management.jmxremote.port=8999 -Dcom.sun.management.jmxremote.ssl=false -Dcom.sun.management.jmxremote.authenticate=false -jar DeploymentUnit3_20240119174346.jar
3. As stated in the documentation, you need a script.groovy file that produces the OpenTelemetry instruments for the custom metrics (exposed by the MBeans of the Java standard classes).
For example, to expose some metrics of the com.genexus.performance package, the script.groovy file would contain:
def beanprocedure = otel.mbean("com.genexus.performance:type=Procedures,name=*")
otel.instrument(beanprocedure, "Count", "The number of executions of the procedure.", "x",
  ["proto_handler" : { mbean -> mbean.name().getKeyProperty("name") }],
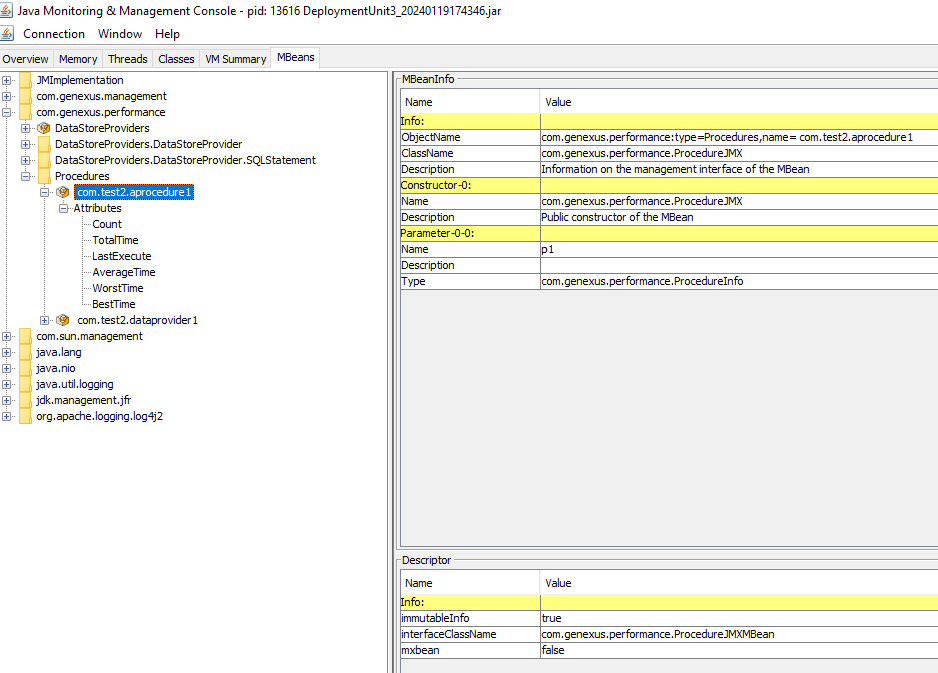
You can explore the MBeans by executing the Jconsole, for example. This can help discover the MBeans exposed by the application.
4. Download the opentelemetry-jmx-metrics.jar to a directory.
Execute the following command line in the same place where you have the opentelemetry-javaagent.jar.
Note that we add the script.groovy reference using a Java System property.
java -Dotel.metrics.exporter=logging -Dotel.exporter.otlp.protocol=grpc -Dotel.jmx.service.url=service:jmx:rmi:///jndi/rmi://localhost:8999/jmxrmi -Dotel.jmx.groovy.script=./script.groovy -Dotel.jmx.remote.registry.ssl=false -Dotel.jmx.interval.milliseconds=5000 -jar opentelemetry-jmx-metrics.jar
The opentelemetry-jmx-metrics.jar is an uber jar that contains the JMX Gatherer.
Using the groovy script you specify which MBeans Opentelemetry should load.
In this case, it is exported to the console (it could have been exported to a backend such as LightStep) and you see the following:
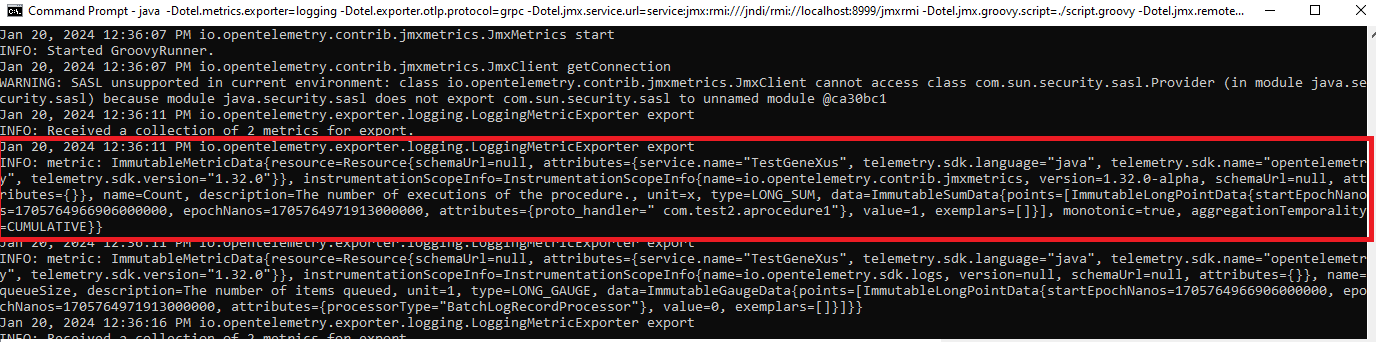
Note: It is also possible to check if the OpenTelemetry backend that you are using has a JMX exporter for custom JMX metrics, such as Prometheus.