The following is a brief guide of how to get application logs in AWS CloudWatch of a .NET application instrumented using OpenTelemetry (OTel).
After following the steps indicated at HowTo: Setup the environment to test Observability (using AWS CloudWatch), you need to add some minor modifications to the configuration if you want to see your application logs.
At docker-compose.yaml (where the application build is defined), add a OTEL resource attribute named aws.log.group.arns in order to correlate logs with traces.
Check the documentation related to this topic.
 # Sample application
  otelsampleapp:
    build:
       context: .
    environment:

      - OTEL_EXPORTER_OTLP_ENDPOINT=http://aws-ot-collector:4317
      - OTEL_RESOURCE_ATTRIBUTES=service.namespace=GeneXus,service.name=sampleGX,aws.log.group.arns="arn:aws:logs:us-east-1:11111111111:log-group:metrics/GeneXus/sampleGX:*"
      - AWS_REGION=us-east-1
      - OTEL_METRICS_EXPORTER=otlp
      - OTEL_TRACES_EXPORTER=otlp
      - OTEL_LOGS_EXPORTER=otlp
      - OTEL_PROPAGATORS=xray
      - GX_LOG_LEVEL=debug
      - ASPNETCORE_URLS=http://*:8080
    ports:
      - "9999:8080"
    depends_on:
      - aws-ot-collector
You get the Log Group ARN at the Log Group settings.
So in the OTel agent configuration file, add this exporter. Do not forget to add it to the service pipeline also.
exporters:
  debug:
    verbosity: detailed
    sampling_initial: 5
    sampling_thereafter: 200
  awsxray:
    region: 'us-east-1'
  awsemf:
    region: 'us-east-1'
  awscloudwatchlogs:
    log_group_name: "metrics/GeneXus/sampleGX"
    log_stream_name: "otel-stream-testgx"
    region: "us-east-1"
    endpoint: "logs.us-east-1.amazonaws.com"

service:
  pipelines:
    traces:
      receivers: [otlp]
      exporters: [awsxray]
    metrics:
      receivers: [otlp]
      exporters: [awsemf]
    logs:
      receivers: [otlp]
      processors: [batch]
      exporters: [awscloudwatchlogs]
You have to replace the settings according to your needs.
There are some permissions that have to be granted to the user (directly through a policy or through IAM Roles), to be able to create Log Groups and Log Streams, and add data to that logs.
See this documentation. Unless the permissions are set, you won't see any logs at CloudWatch or even the Log Groups and Streams will not be created.
You can also check Identity and access management for Amazon CloudWatch Logs.
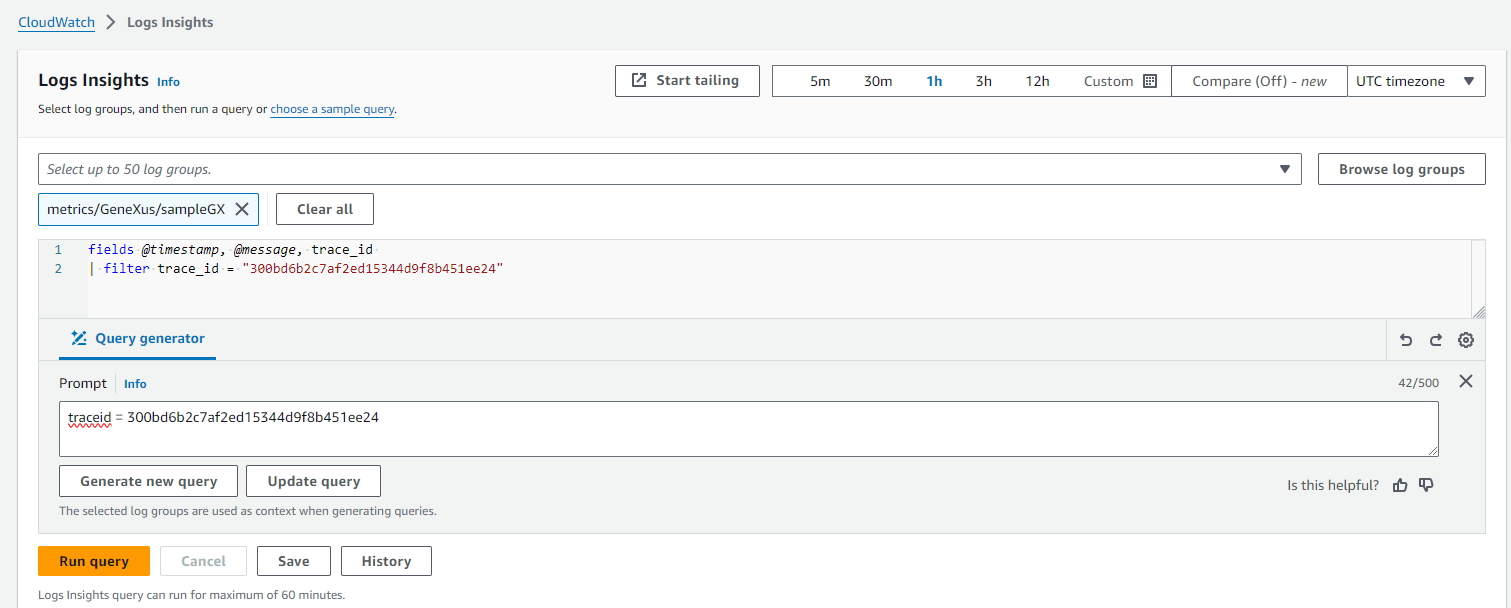
After those configuration steps, you can execute the application and see your logs, using Logs Insights.
You can filter by the trace Id, like in the following figure:
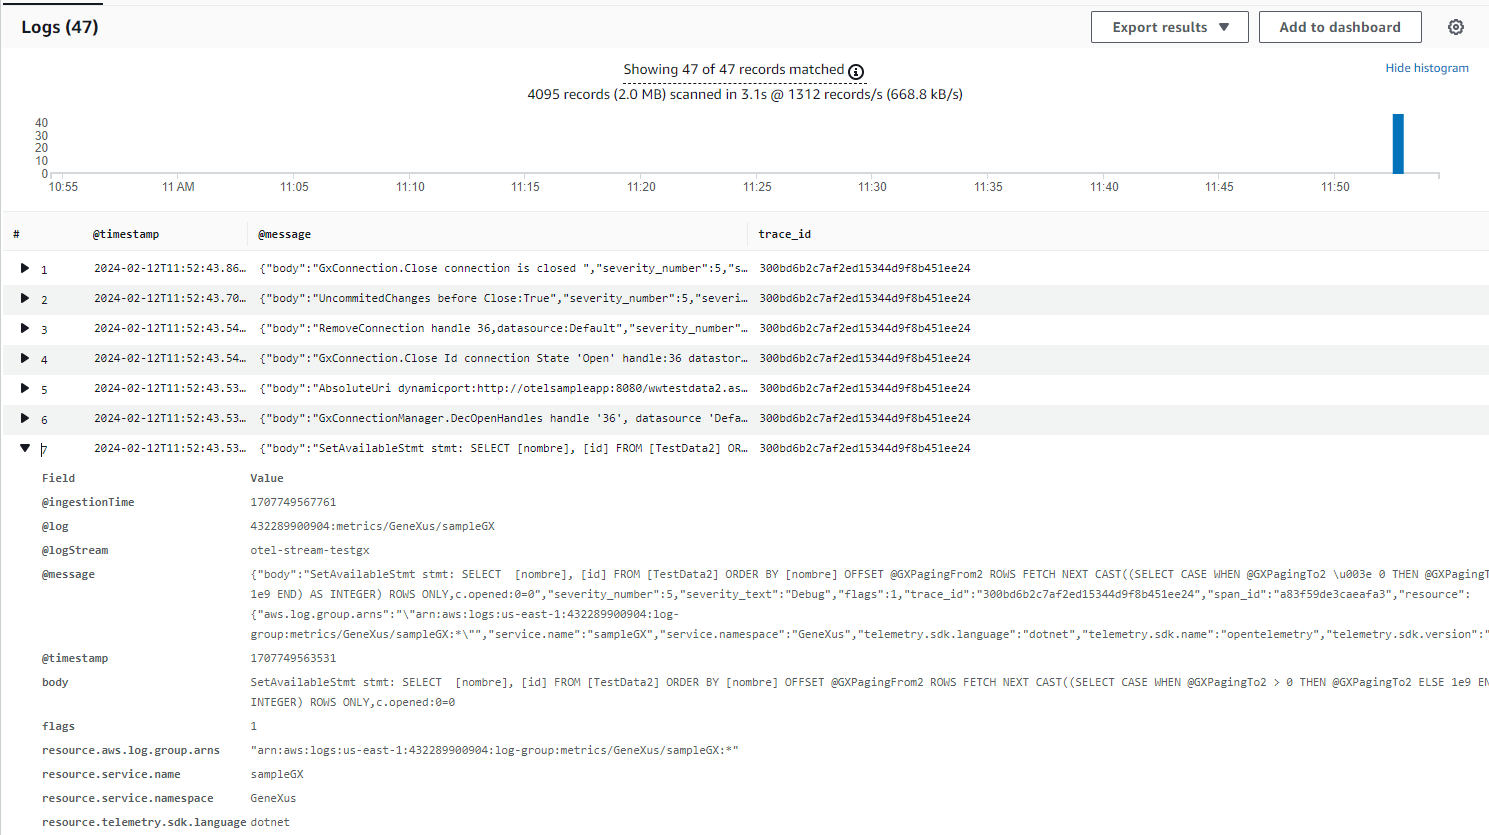
And get all the Logs of that trace:
Since GeneXus 18 Upgrade 8