After following the steps in HowTo: Set up the environment to test Observability (using Grafana) you can make some minor changes to your configuration to see your application logs.
First, add Jaeger and Loki services to your docker-compose.yaml file.
Your docker-compose.yaml would be as follows (besides the other settings explained in this document):
# OpenTelemetry Collector
  otel-collector:
    image: otel/opentelemetry-collector-contrib:0.88.0
    volumes:
      - ./otel-config.yaml:/etc/otel/otel-config.yaml
      - ./log:/log/otel
    command: --config /etc/otel/otel-config.yaml
    environment:
      JAEGER_ENDPOINT: "jaeger:4317"
      LOKI_ENDPOINT: "http://loki:3100/loki/api/v1/push"
    ports:
      - "8889:8889"   # Prometheus metrics exporter (scrape endpoint)
      - "13133:13133" # health_check extension
      - "55679:55679" # ZPages extension
      - "4317:4317"
      - "4318:4318"
    depends_on:
      - jaeger
      - prometheus
      - loki

jaeger:
    image: jaegertracing/all-in-one:1.50.0
    ports:
      - "16686:16686" # Jaeger Web UI

loki:
    image: grafana/loki:2.7.4
    ports:
      - "3100:3100"
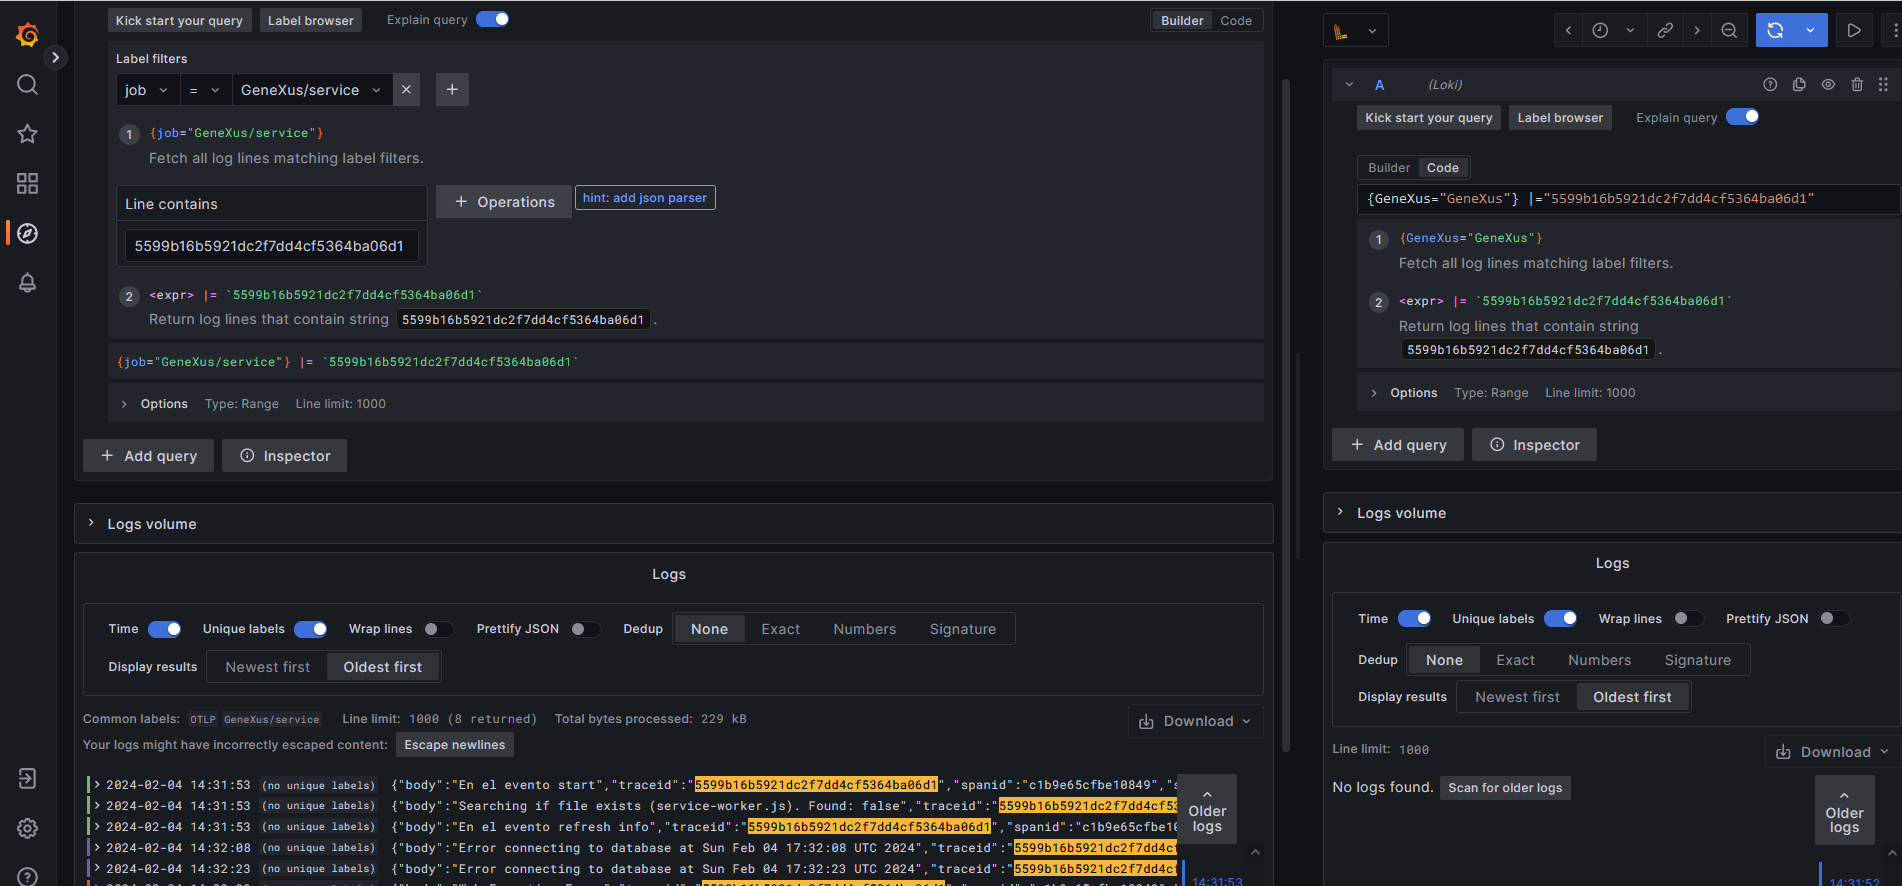
One way to see application logs is to define a Jaeger datasource at Grafana UI.
There, you should set the basic settings, such as URL = http://jaeger:16686.
You should specify the Trace To Logs section, where you indicate the following:
- Data Source = Loki
- Filter By Trace Id set to On (This is to get logs correlated to Traces)
- Tags: For instance, it can be the service.namespace you set at the OTel Collector resource attributes setting. Ex:. service.namespace = GeneXus.
For more information, see Grafana Jaeger datasource.
