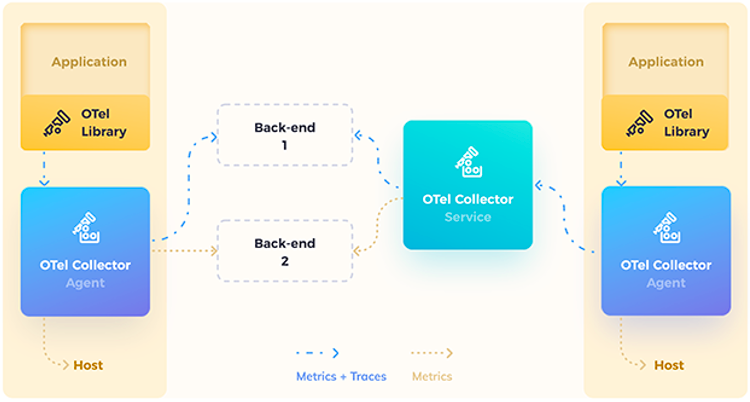
GeneXus collects telemetry data (traces, logs, and metrics) of its applications with OpenTelemetry.
The steps you must follow to use it are:
- Set the Observability Provider property.
- Execute the OpenTelemetry collector.
- Configure the Environment Variables. See General purpose configuration and OTLP Exporter configuration.
- Configure the Collector with an Observability Backend.
- Execute.
Select the value Opentelemetry in the
Observability Provider property.
Follow the document Getting Started to execute the collector.
Configure the following environment variables in the application’s Docker Image.
For more information, refer to: SDK Configuration.
OTEL_EXPORTER_OTLP_ENDPOINT=http://otel-collector:4317
OTEL_METRICS_EXPORTER=otlp
OTEL_RESOURCE_ATTRIBUTES=service.namespace=GeneXus,service.name=sample-app,service.version=1.0.1
Refer to the Configure document.
If the application runs in Docker, it is possible to execute OpenTelemetry through Docker Compose.
You may execute the following compose.yaml that has the configured collector connected to the GeneXus application to be deployed.
otel-collector-confing.yaml sample can be seen here: https://opentelemetry.io/docs/collector/configuration/
compose.yaml:
version: "2"
services:
   # Collector
  otel-collector:
    image: otel/opentelemetry-collector-dev:latest
    command: ["--config=/etc/otel-collector-config.yaml", ""]
    volumes:
      - ./otel-collector-config.yaml:/etc/otel-collector-config.yaml

    ports:
      - "4317:4317"   # OTLP gRPC receiver
      - "4318:4318"   # OTLP Http receiver

  smaplegenexusapp:
    build:
      context: .
    environment:
      - OTEL_EXPORTER_OTLP_ENDPOINT=http://otel-collector:4317
      - OTEL_RESOURCE_ATTRIBUTES=service.namespace=GeneXus,service.name=sample-app,service.version=1.0.1
      - OTEL_METRICS_EXPORTER=otlp
      - GX_LOG_LEVEL=info
      - GX_LOG_LEVEL_USER=debug
      - GX_LOG_OUTPUT=ConsoleAppender

    ports:
      - "80:80"
Generator: Java, .NET
This functionality is available since GeneXus 18 Upgrade 4.
Log settings with environment variables