Azure Monitor is the native monitoring solution for Microsoft Azure aimed at helping users maximize application availability and performance. Azure Monitor provides users with full observability into their cloud and on-premise environments, collecting and analyzing data from a variety of sources before storing the information to be processed later (similar to Amazon CloudWatch).
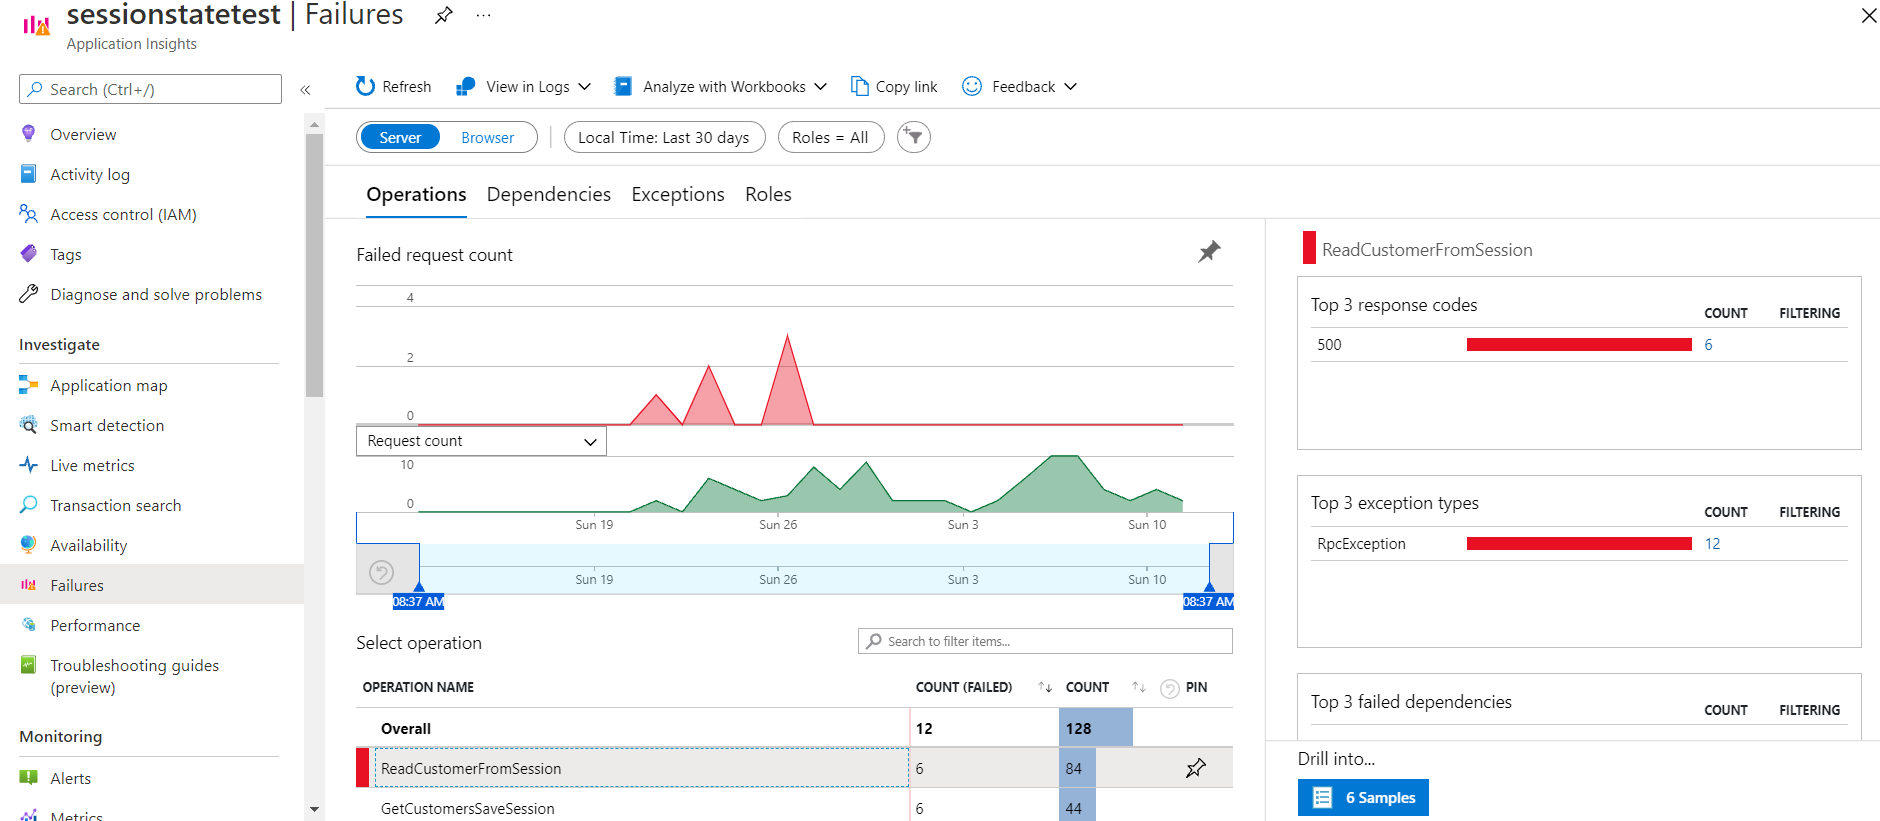
Application Insights is a feature of Azure Monitor used to monitor your live applications. It automatically detects performance anomalies and includes analytics tools to help you diagnose issues.
You can create an Application Insights instance when you create your function app. In this case, the instrumentation key required for the integration is already set as an application setting named APPLICATIONINSIGHTS_CONNECTION_STRING.
If your function app doesn't have the instrumentation key set, you need to enable Application Insights integration.
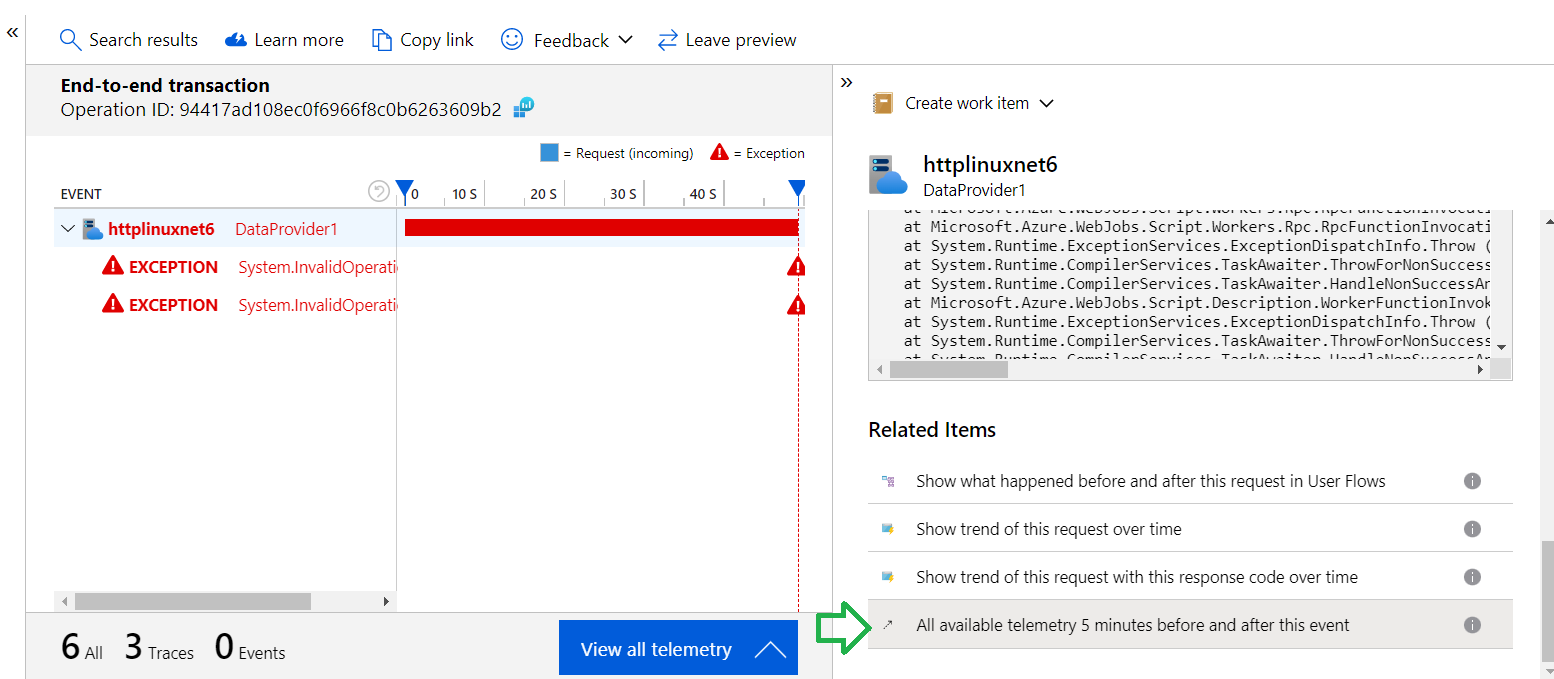
For example, if you see an error in the monitor, you can use Application Insights to get the complete stack and details of the error.
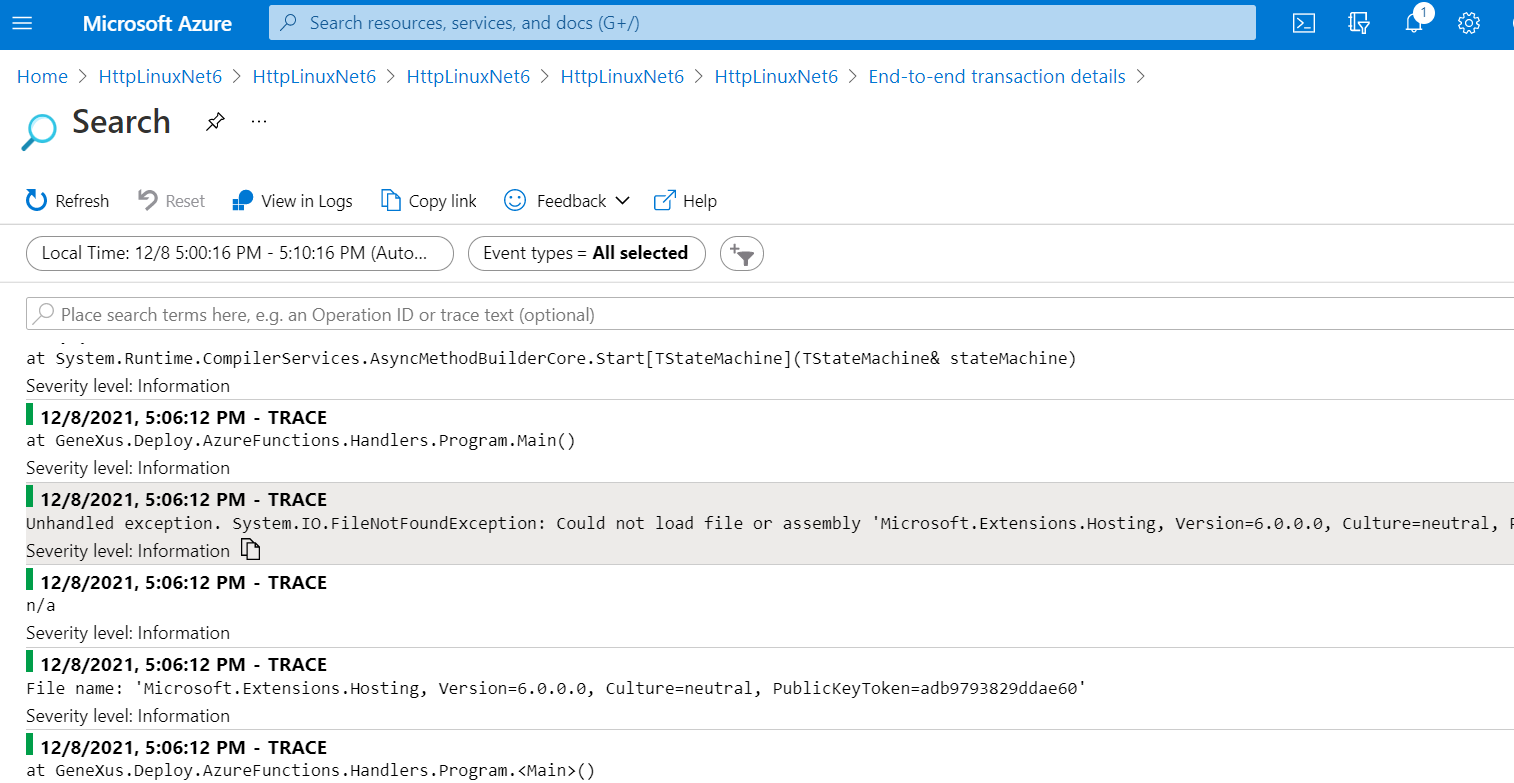
Moreover, you can get detailed information if you go through the option "All available telemetry 5 minutes before and after this event"
With Application Insights integration enabled, telemetry data is sent to your connected Application Insights instance. This data includes logs generated by GeneXus.
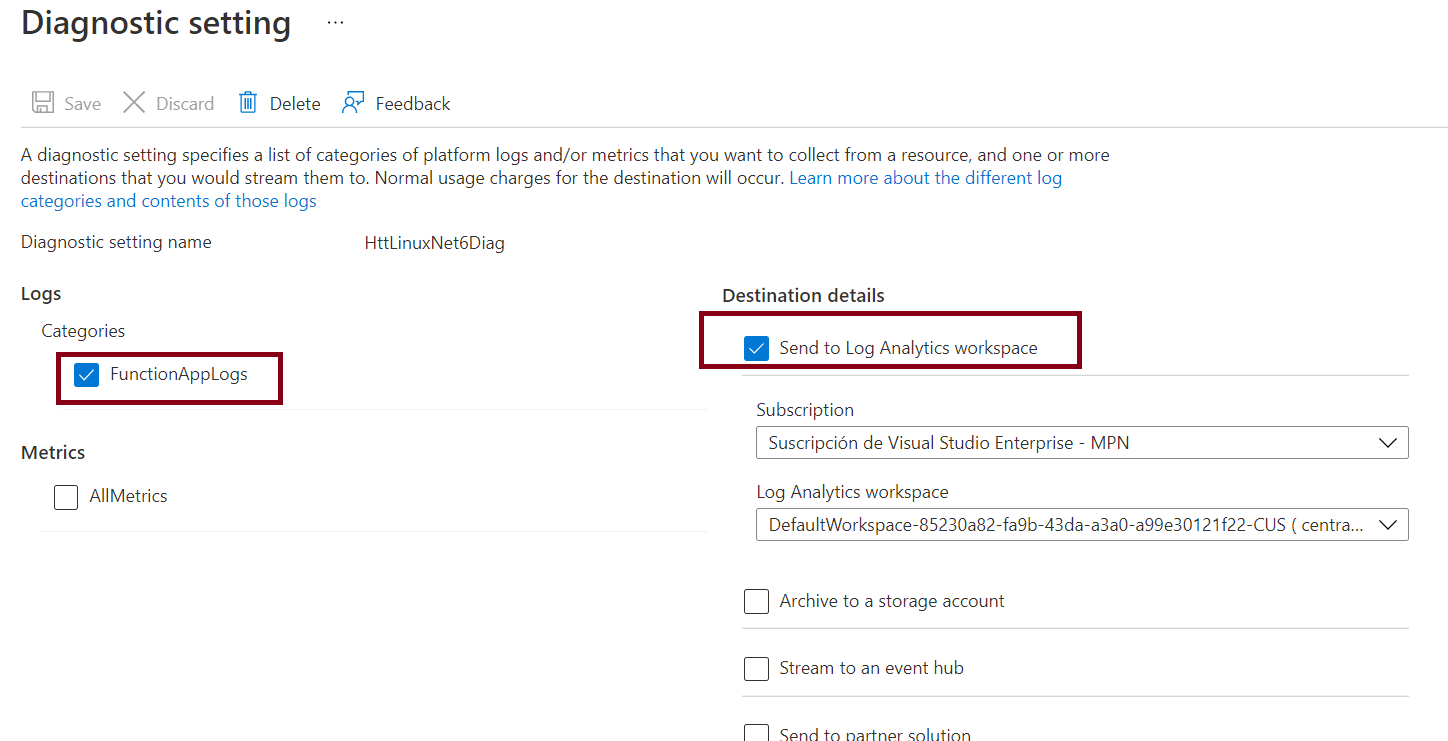
Go to Diagnostic Settings in the Azure portal, and add a Diagnostic setting.
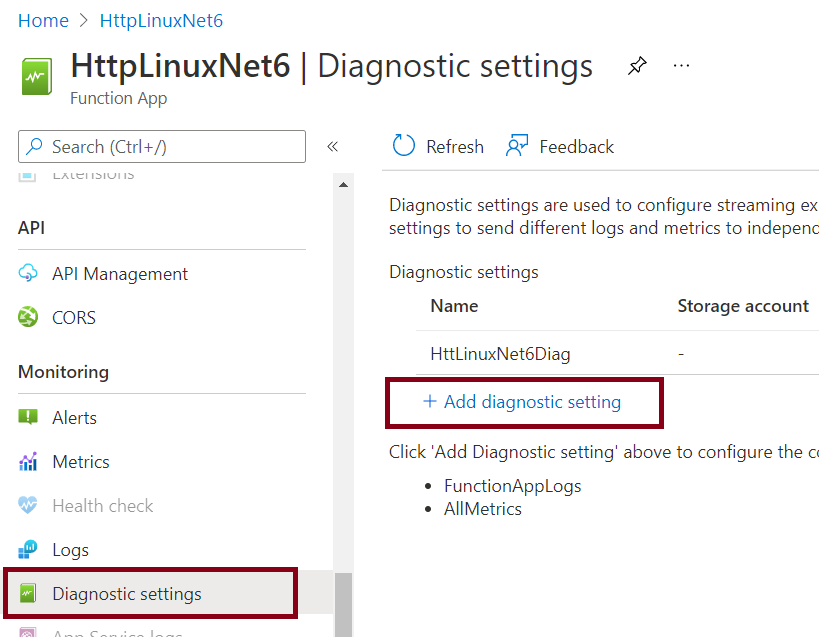
Next, below Categories select "FuntionAppLogs", and below Destination details select "Send to log analytics workspace" as shown in the following image.
Another option would be to do the following:
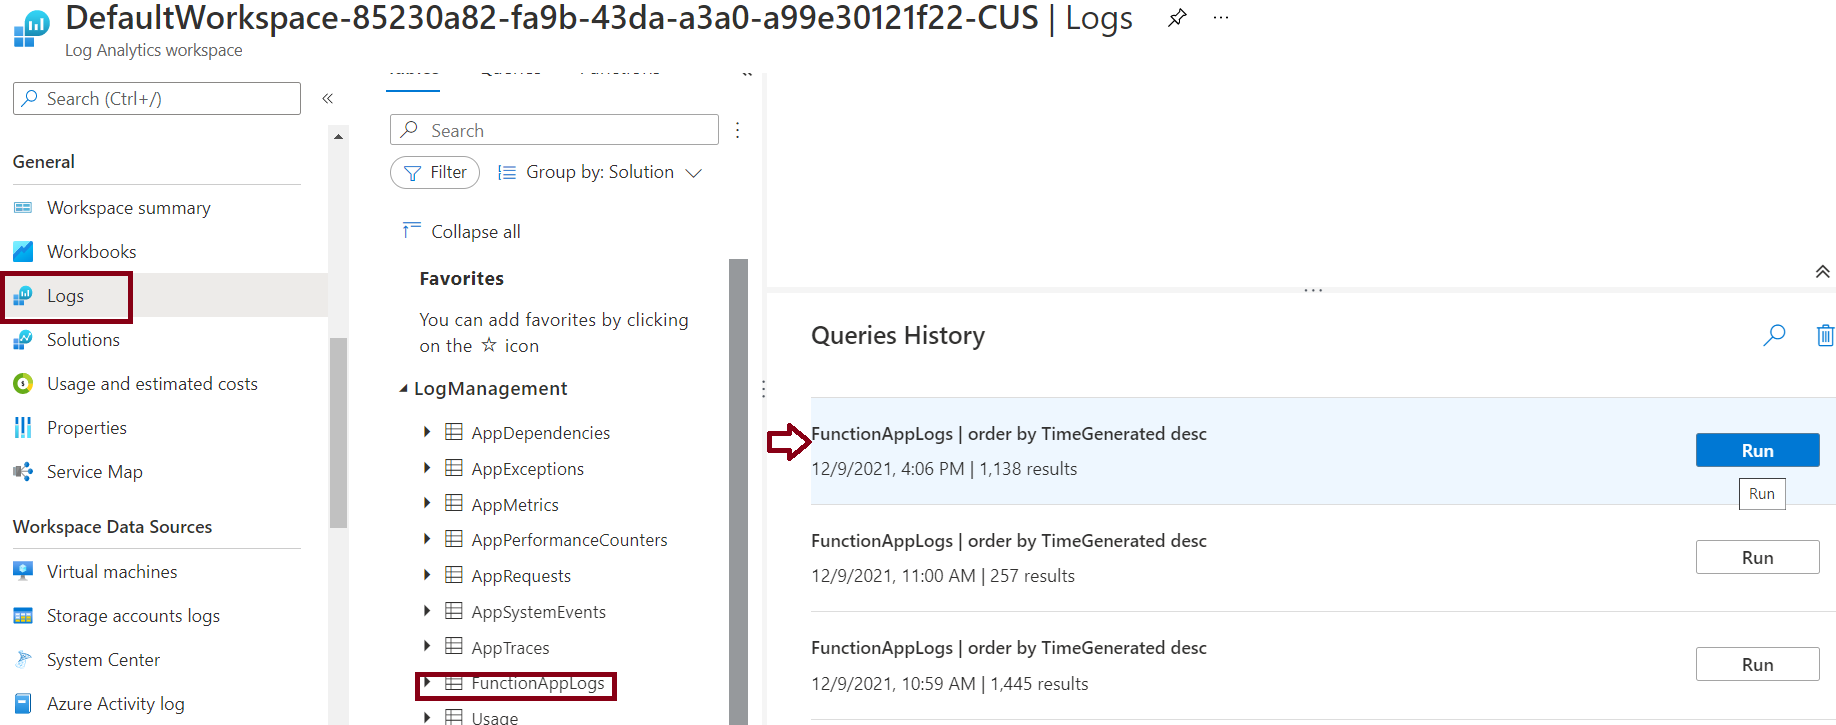
Configure the Log output property to "Console Appender" value, and check the logs going through the Log Analytics workspace you selected. Then go to the "Logs" option on the left side menu, and run the query over the FunctionAppLogs table.
For detailed information on this topic, see Monitoring Azure Functions with Azure monitor logs.
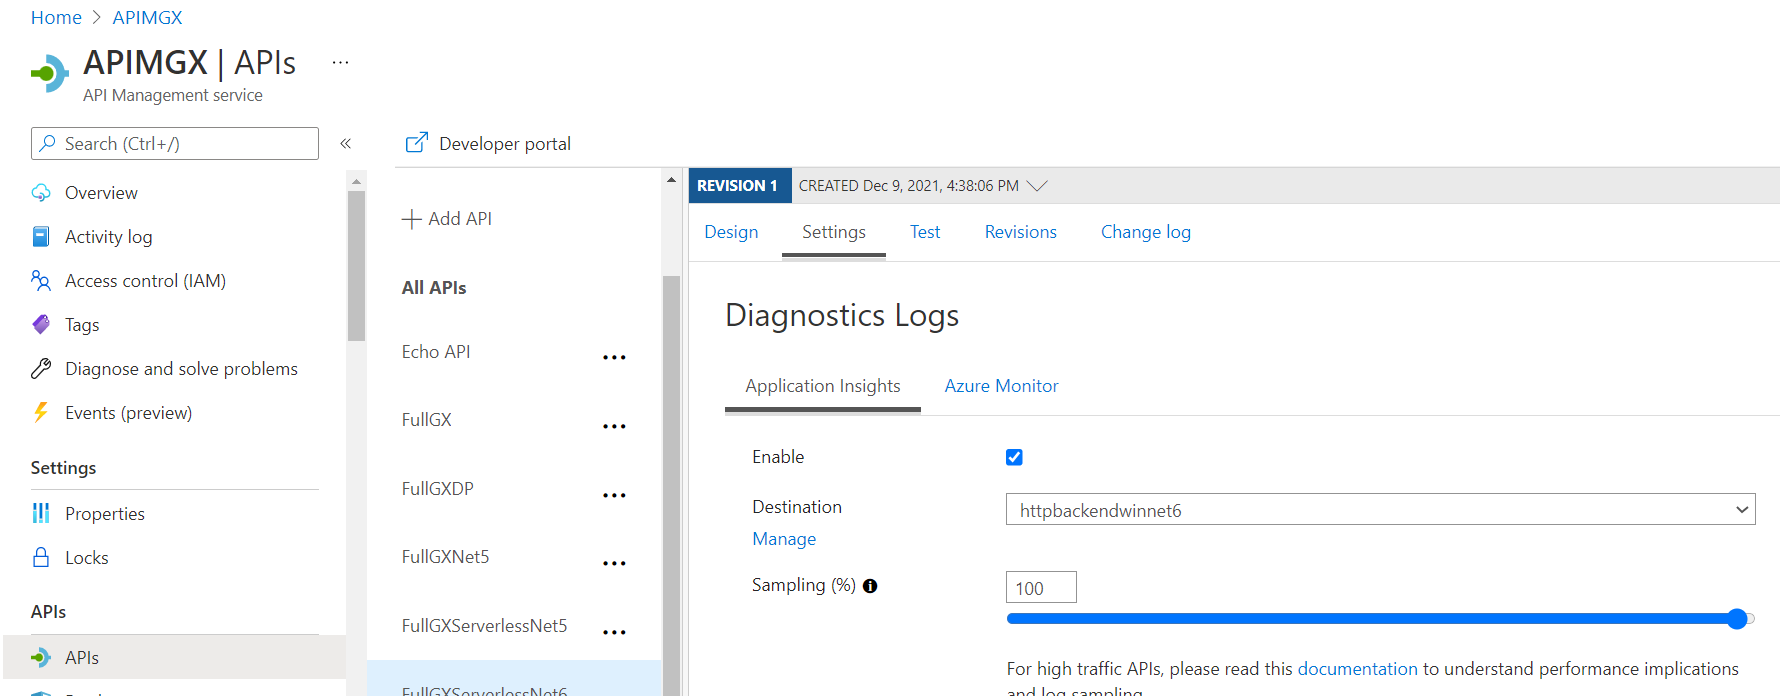
Note that you can also activate Application Insights for API Management:
HowTo: Troubleshoot Azure functions