GeneXus enables monitoring and analyzing the performance of applications using the features and capabilities of Azure Application Insights through instrumentation for:
- .NET Web applications running elsewhere.
- Java Web containerized applications (Deploy to Docker). As auto-instrumentation in Java consists only on attaching a Java agent JAR to any Java 8+ application. It can be done at production using infrastructure configuration.
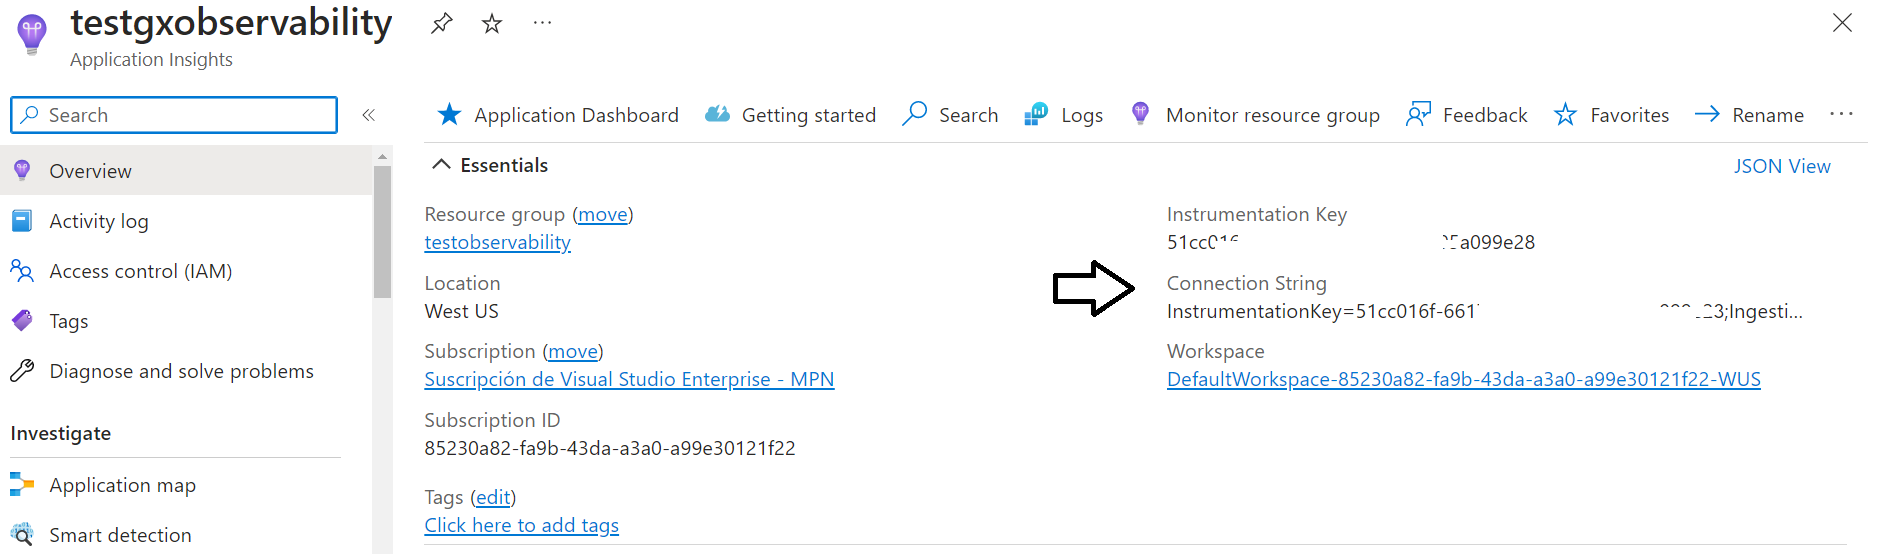
Assuming you have already defined the Application Insights and have access to the Connection String, as the figure shows, you can follow the steps below:
- Set the Observability Provider property.
- Deploy your application.
- Configure the Environment Variables.
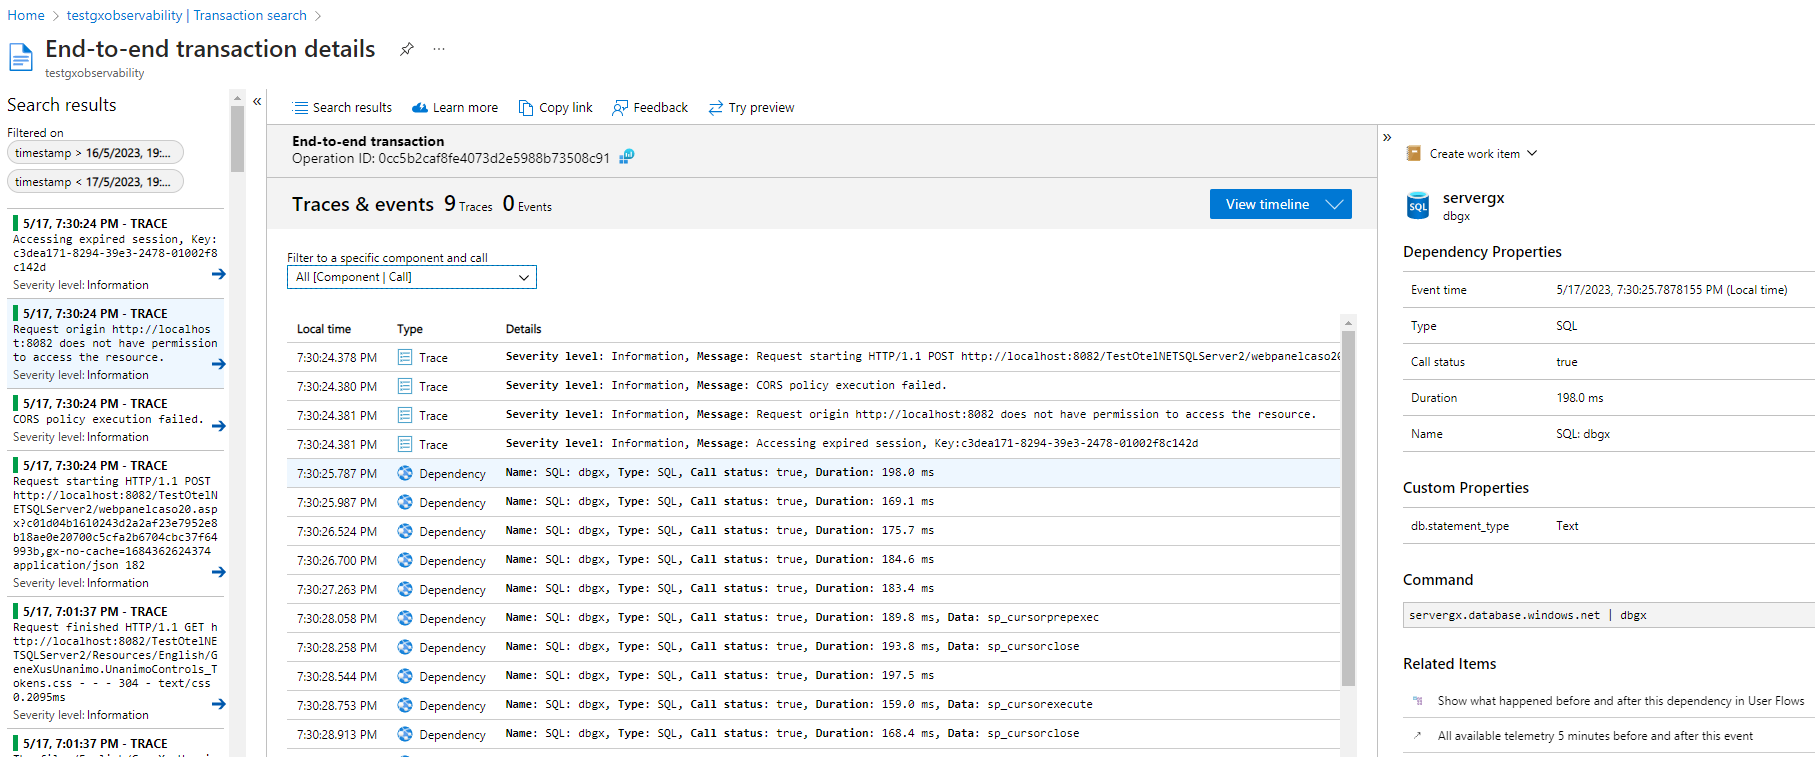
- Analyze the data.
Set the Observability Provider property to "Azure Monitor Application Insights" value.
In Java, use the deployment engine tool to deploy your app to Docker (builds a Docker image).
Set an environment variable pointing to the Connection String.
The environment variable should be:
APPLICATIONINSIGHTS_CONNECTION_STRING=<Connection String>
For the case of containerized applications, you set the environment variable when you run the Docker image.
If the environment variable is not set, the connection string will be calculated using a default Credential authentication flow based on the order explained here. This applies to applications that will be deployed to Azure.
docker run -p 8081:8080 -e APPLICATIONINSIGHTS_CONNECTION_STRING="InstrumentationKey=00000000-0000-0000-0000-000000000000;IngestionEndpoint=https://westus-0.in.applicationinsights.azure.com/;LiveEndpoint=https://westus.livediagnostics.monitor.azure.com/" miImageId
Note: You may need to add other environment variables, such as
APPLICATIONINSIGHTS_ROLE_NAME. See
here for more information. The app which is going to be instrumented, and its components don't have to be hosted in Azure. The instrumentation monitors your app and directs the telemetry data to an Application Insights resource using a unique token.
In case of .NET and Azure Monitor, you just need to set the Observability Provider property to Azure Monitor Application Insights.
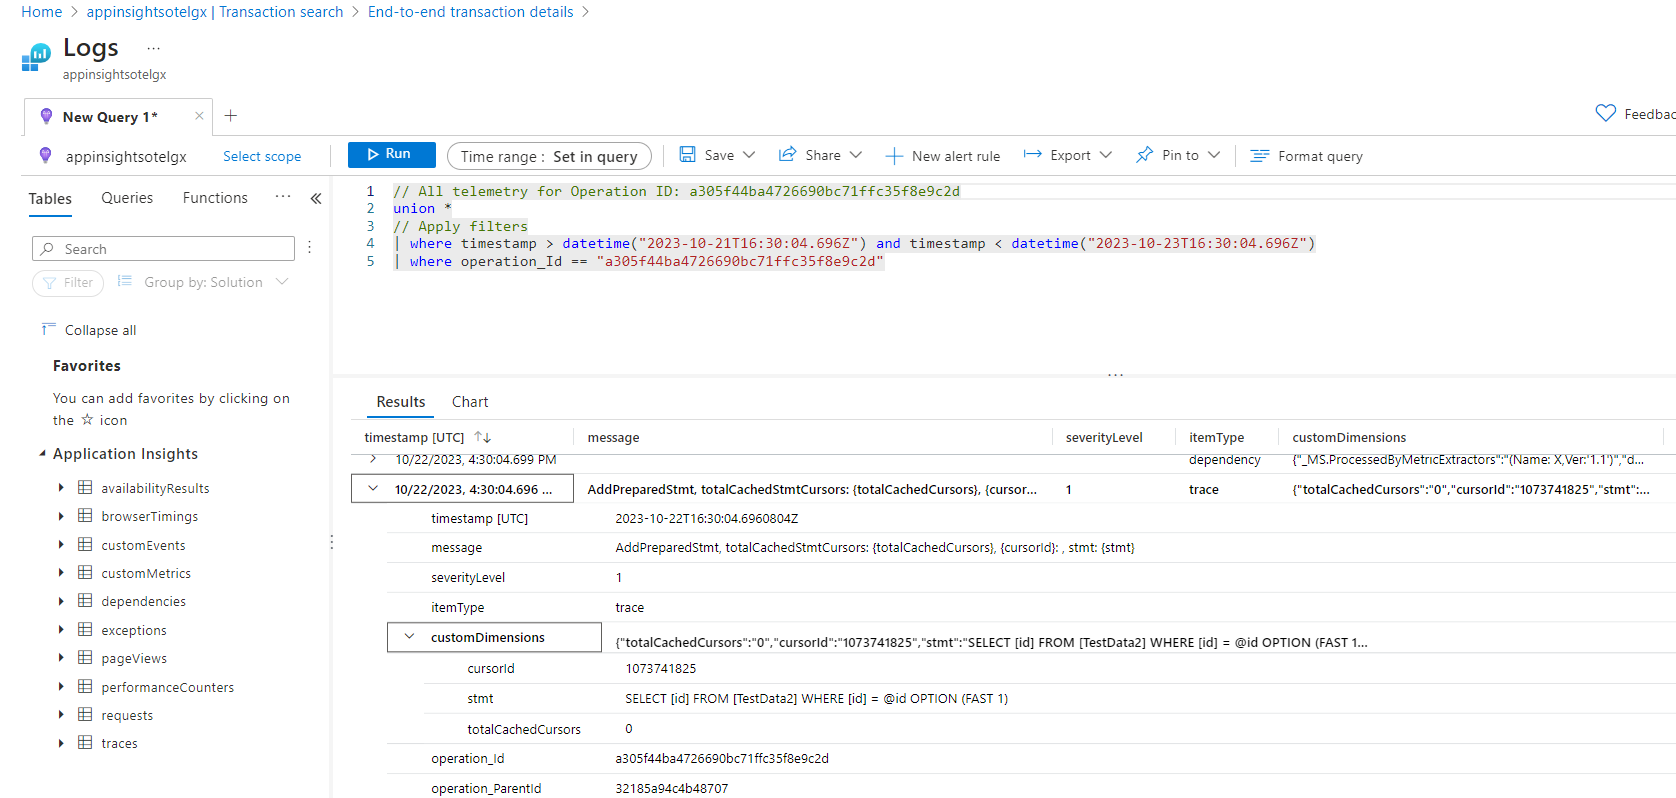
The Operation_id (which is the same as the trace id of Opentelemetry) will be present at the logs, and you can get the logs for each trace by filtering by the OperationId.
The log level should be set using GX_LOG_LEVEL environment variable.
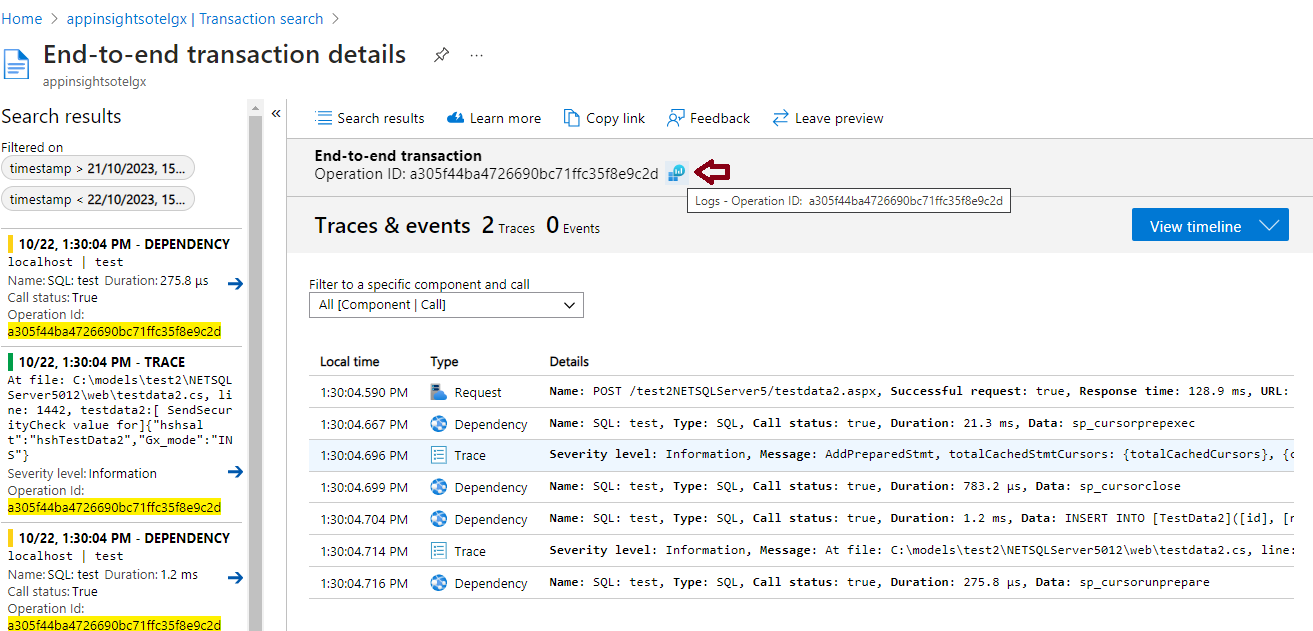
After selecting the OperationId, you can see the logs for that trace.
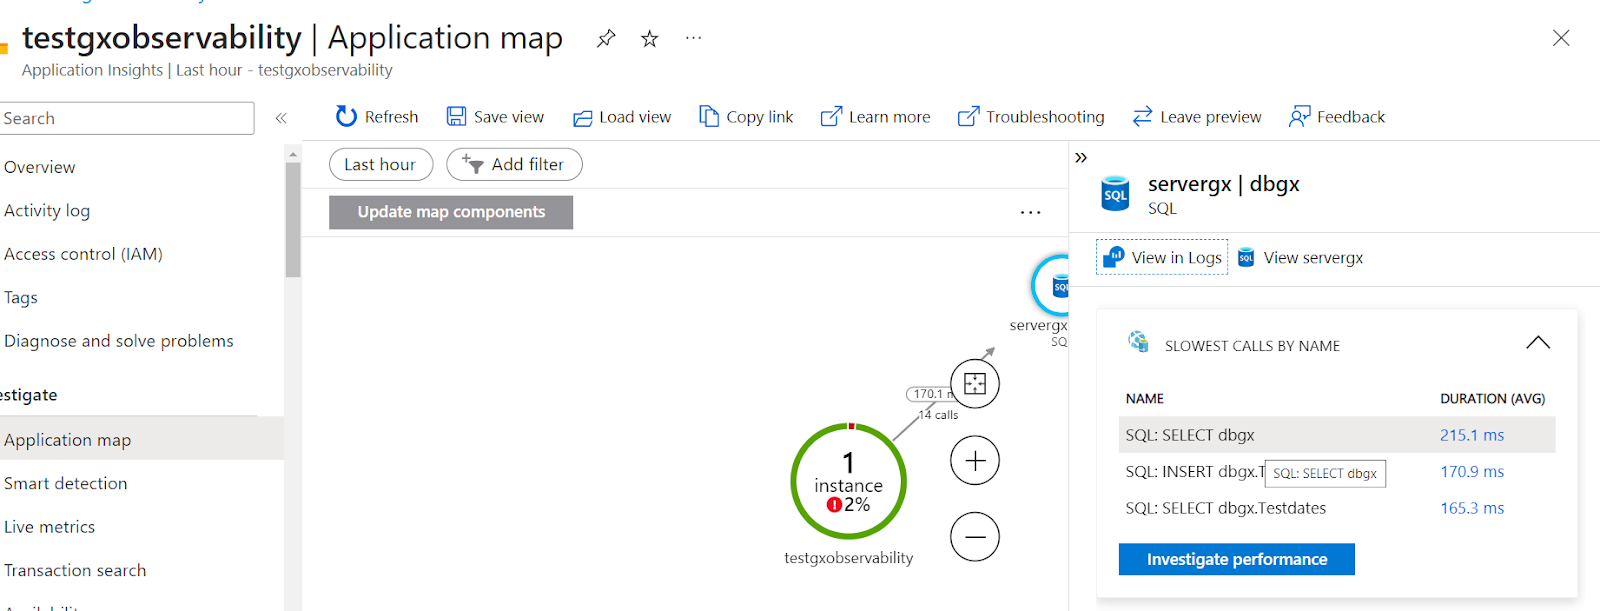
After running the application, follow the steps in the Azure documentation to analyze the data obtained. See Distributed tracing telemetry correlation.
Generator: Java, .NET
This functionality is available since GeneXus 18 Upgrade 4.
Configuration options: Azure Monitor Application Insights for Java