QueryViewer is an Extended Control that must be included in a Web Panel object or Panel object to allow viewing the data obtained as a result of executing a Query object or a Data Provider object. The possible viewing options are:
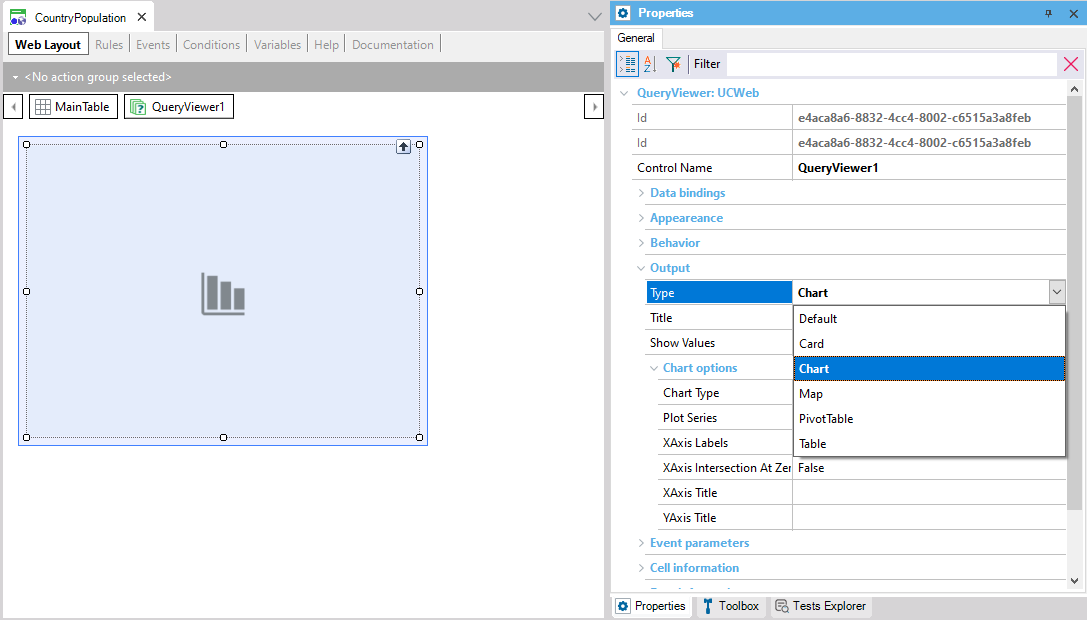
- Card: is a static representation of the query value that can show its trend.
- Chart: several kinds of charts can be selected, including Timeline chart, Circular Charts, Polar Charts, and more.
- Map: is a map of the world, a continent, or a country for queries containing a geographic axis (available since GeneXus 17 upgrade 4).
- Pivot Table: is a table that allows swapping columns and grouping information.
- Table: is a static table, with fixed rows and columns.
Important note: Support for mobile applications has been available since GeneXus 17.
- Compatible with all browsers, including smartphones.
- Allows exporting data to PDF, HTML, XML, and XLSX formats (only valid for Table and Pivot Table options).
- Intuitive handling of Pivot Tables by using drag and drop.
- Programmatically configurable as well.
Note: Attributes can be hidden in the Table and Pivot Table just by right-clicking on the right corner of the attribute. In the Pivot Table case, remember that if all the Data attributes are hidden, the Quantity field will appear and it will not be possible to hide it.
The following steps describe how to work with this control for a web application (for Native Mobile applications, it works in the same way).
1) Drag the QueryViewer control from the Toolbox to the Web Layout of a Web Panel object.
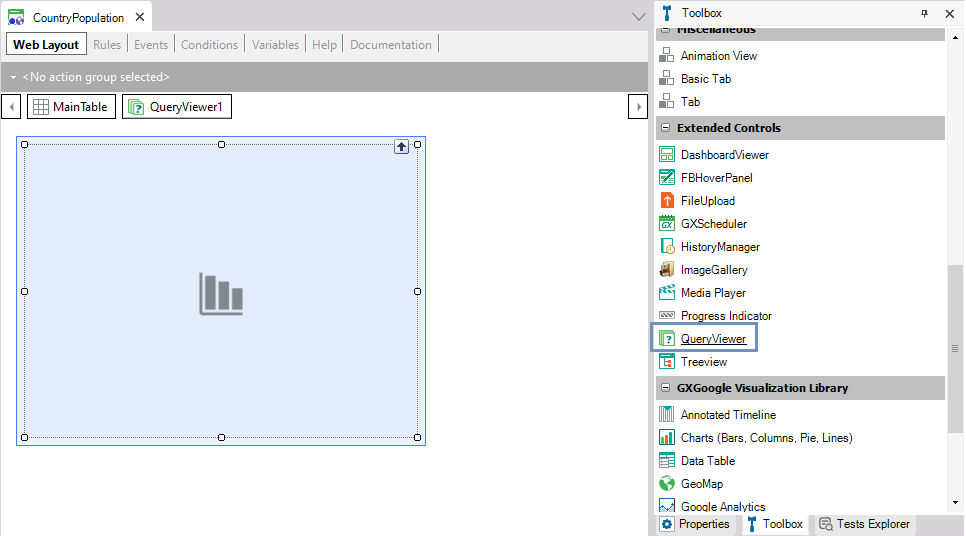
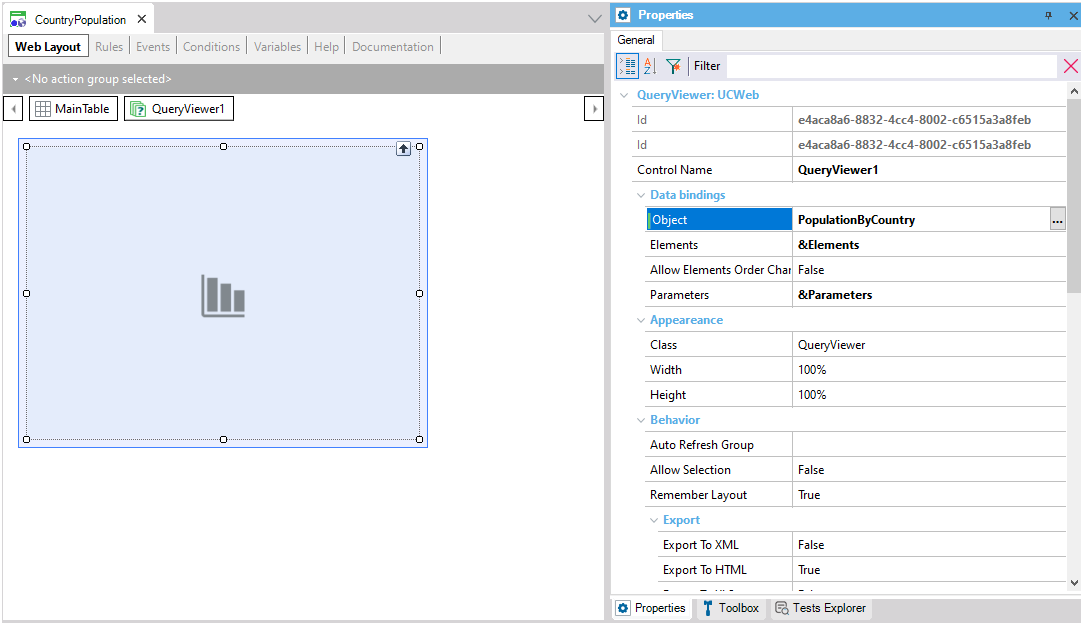
2) Complete the Object property of the QueryViewer control with the Query object or Data Provider object that will generate the data to be displayed.
3) Set the Type property below the Output group. This allows you to select one of the five ways in which the output can be displayed:
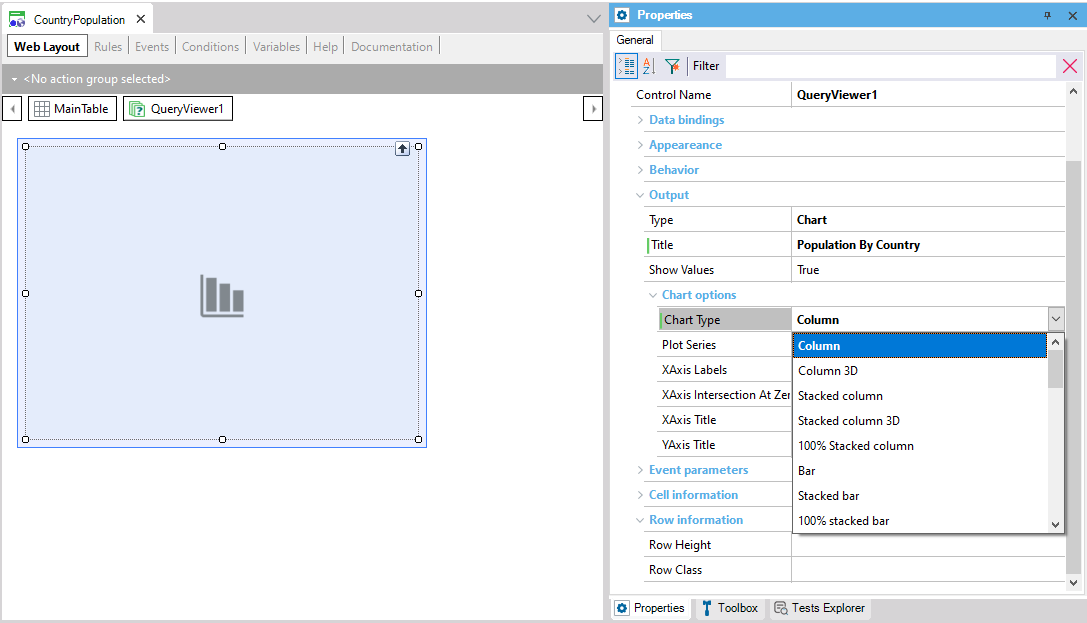
When selecting the Chart option, you can choose a specific type of chart by setting the Chart Type property:
4) This is enough to execute the object that contains the QueryViewer control to see the result at runtime.
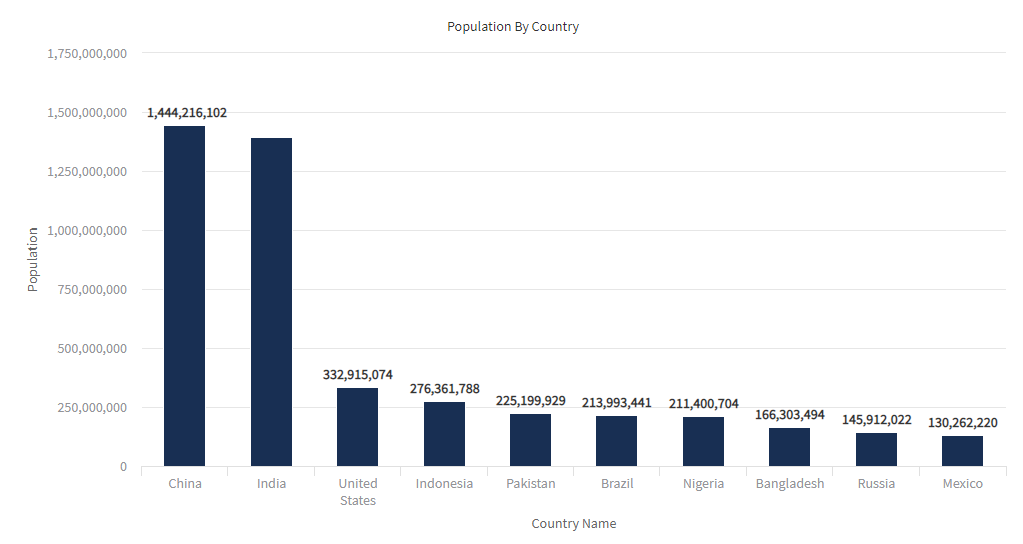
In addition, you may set other QueryViewer properties. For example, the following properties related to a column chart:
- XAxis Title = Country Name
- YAxis Title = Population
As a result, the following query is displayed at runtime:
Note: The first time that a QueryViewer control is dragged to a web form in a Knowledge Base, GeneXus will include the GeneXusReporting module containing the Structured Data Type necessary for using the control, as well as a set of new GeneXus Domains. Also, a set of variables is automatically created in the Object Variables section, and a sample source is added in the Object Events section. This code is intended to guide you in using and setting the control at runtime.
Below are some scenarios you can find when using the QueryViewer control:
- Dynamic filter to obtain new views of a query
New views of a single query are possible by changing the value shown of one participant in the query (Query Element). This is done by passing parameters between the QueryViewer control and the query.
- Customizing a QueryViewer control at runtime
Through the associated variable in the Axes property, it is possible to change programmatically some of the properties that have an impact on the control’s view.
- Changing queries at runtime
It is possible to change the query associated with the control by replacing it with a different one, by altering the control’s Object property, as in the following example:
Event Start
  Attractions.Object = AttractionsByCountry(<Parameter1>, <Parameter2>, ...)
EndEvent
In this example, Attractions is the QueryViewer control’s name, Object is the control’s property that stores the name of the Query object that performs the query, and AttractionsByCountry is the name of that Query object. The same applies if the associated object is a Data Provider object.
- Changing aggregation by code
If a Data Provider object is associated with the Quer Viewer, aggregation can be changed by code using the QueryViewerElements.Element Aggregation field.
The default aggregation is Sum.
Please refer to QueryViewer control properties.
| DragAndDrop Event |
Allows programming actions when a drag and drop action is found. |
| ItemExpand Event |
Allows programming actions when the user expands a Query Element that contains nested data. |
| ItemCollapse Event |
Allows programming actions when the user collapses a Query Element with nested data. |
| FilterChanged Event |
It is executed every time values are removed from or added to the list of possible values for an attribute, whether it’s located in the rows, columns, or pages area. |
| ItemClick Event |
It is executed upon clicking on a query element. |
| ItemDoubleClick Event |
It is executed upon double-clicking on a query element. (This event is not supported if you are running the control on a mobile device) |
| GetMetadata() |
Returns a QueryViewerElements type object which contains the list of attributes (properties included). (More information about Elements Property) |
| GetData() |
Returns an XML on a string variable containing all the data for the attributes loaded in the Pivot Table. |
| GetFilteredData() |
Returns an XML on a string variable containing the data that is being viewed at the moment (the difference with the GetData() method is seen on the Pivot Table; data can be different because of filter application). |
| NotifyMetadata() |
Makes a list of attributes (properties included). This method doesn't return an object as a result but generates a QueryViewerElements type variable that can be captured later by a TrackContext event. |
| NotifyData() |
Loads all the data referenced by the attributes loaded in the Pivot Table. This method doesn't return an object as a result but generates a variable that can be captured later by a TrackContext event. |
| NotifyFilteredData() |
Loads the data that is being viewed at the moment with filters applied (it can be different from the data loaded by the method NotifyData()). This method doesn't return an object as a result but generates a variable that can be captured later by a TrackContext event. |
As an example of usage, see how to save/restore metadata to/from the Database. To do so, define the following events in the Web Panel where the QueryViewer is embedded:
Saving the metadata
Event 'NotifyMetadata'
  QueryViewer.NotifyMetadata()
Endevent

Event TrackContext(&Metadata)
  SaveMetadata(&Metadata)
EndEvent
Restoring the metadata
Event Refresh
   &Axes = RestoreMetadata()
EndEvent
Notes:
- The SaveMetadata and RestoreMetadata Procedure objects have to be implemented.
- The &Metadata variable has to be defined based on the QueryViewerElements SDT.
- The Remember Layout property of the QueryViewer control has to be set to False.
QueryViewer control compatibility