In the Globant Enterprise AI Frontend, once you have configured the Chat with Data Assistant by following the steps in How to create a Chat with Data Assistant, you will have the ability to perform queries and adjust them according to your needs. This means that you will be able to modify the queries in various ways, such as changing the output format, applying filters, sorting the results, and even creating rankings as needed. In addition, you will have the option to save your queries for future reference and retrieve saved queries to continue editing them as required.
Below, you will find examples that illustrate how to change the output format, apply filters to the data, sort the output, obtain a timeline, and generate a top X of specific data.
The assistant has 4 possible display formats:
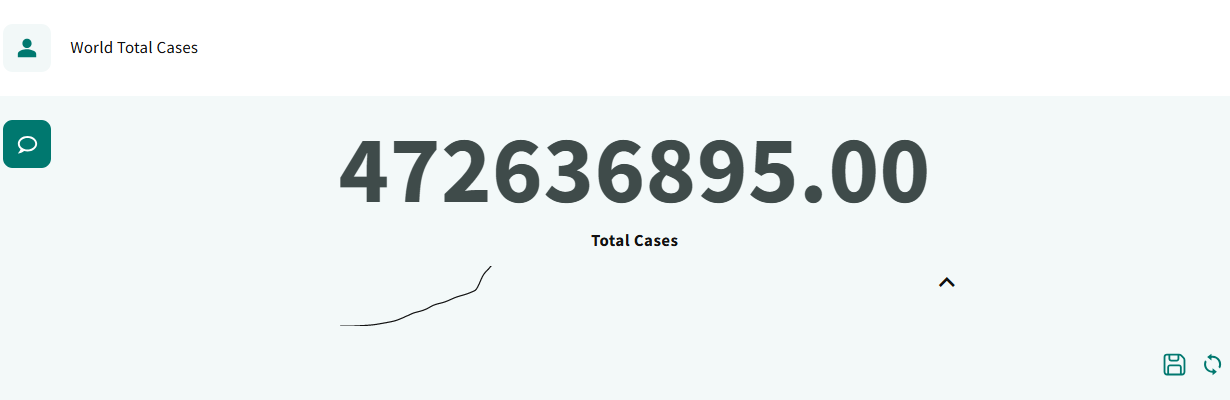
- Card: statically represents the query value, showing its trend.
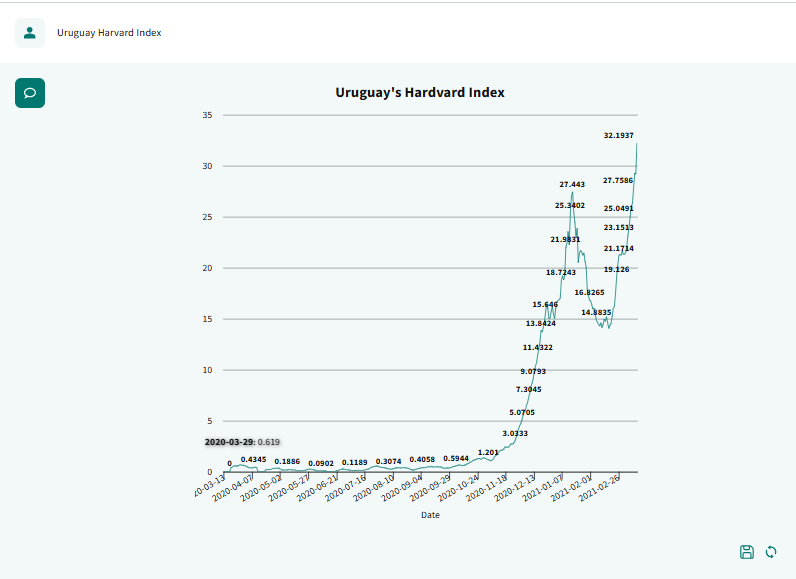
- Chart: visually represents data with various types available, such as column, bar, line, area, pie, timeline, radar or polar charts.
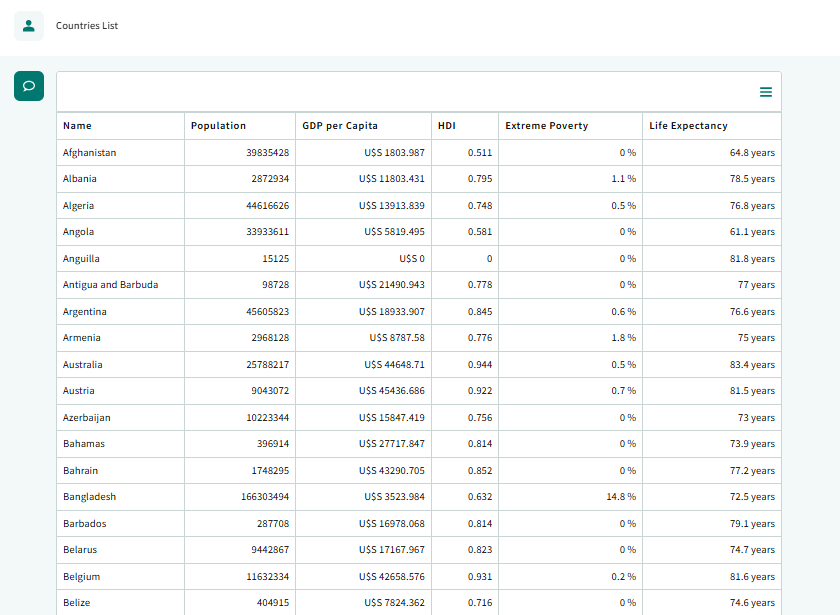
- Table: displays data in a static format with fixed rows and columns.
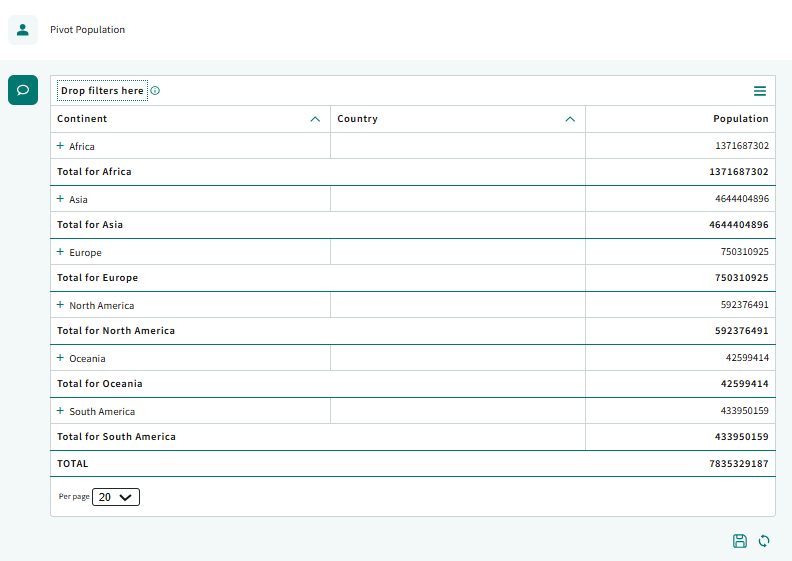
- PivotTable: displays data in a table format that allows for flexible column swapping and grouping of information.
When you perform a query and do not specify an output format, the assistant will automatically select the most appropriate format according to the type of data and the nature of the query performed.
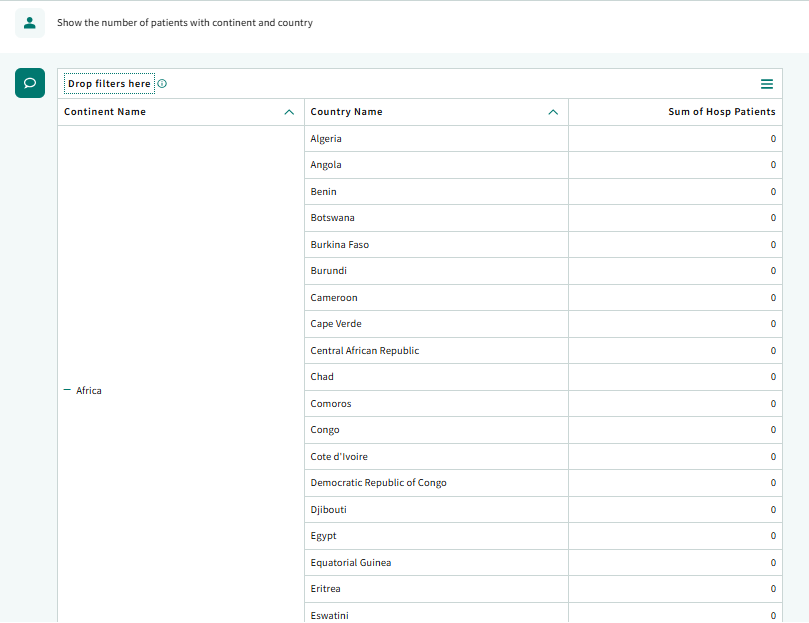
For example, if you request 'Show the number of patients with continent and country', the assistant will choose a PivotTable as the default output.
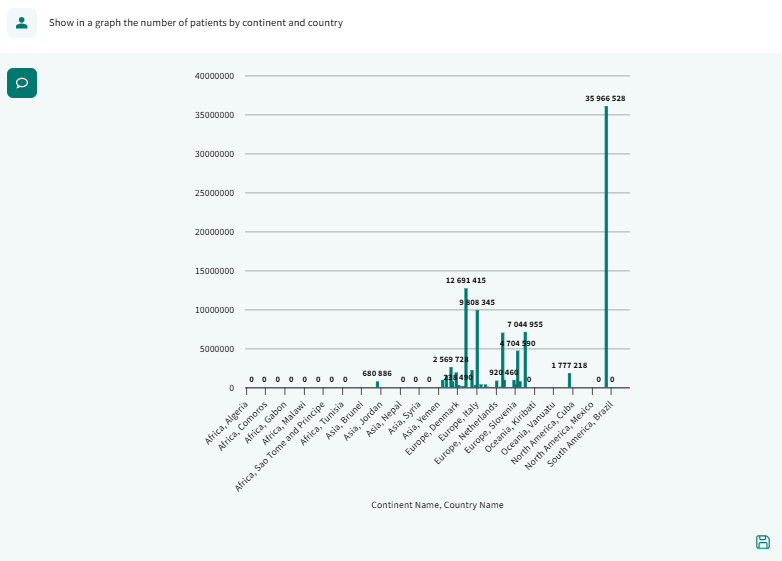
If you prefer to represent the same query in a graph, you can express it as 'Show in a graph the number of patients by continent and country'. In this case, the assistant will use a bar chart as the output format.
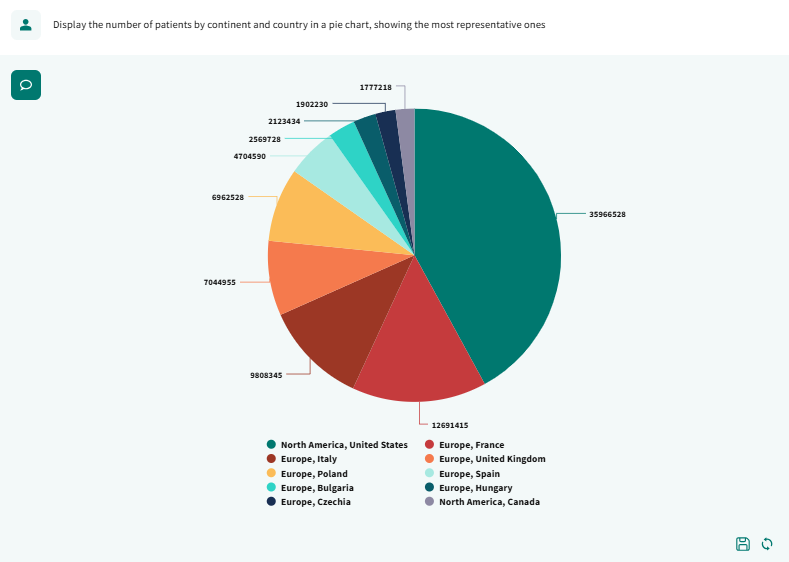
To select a specific type of chart, you only need to clarify the desired format. For example, if you wish to represent the number of patients by continent and country in a pie chart with the most representative data, simply specify: 'Display the number of patients by continent and country in a pie chart, showing the most representative ones'. In response, the assistant will generate a pie chart with the requested data.
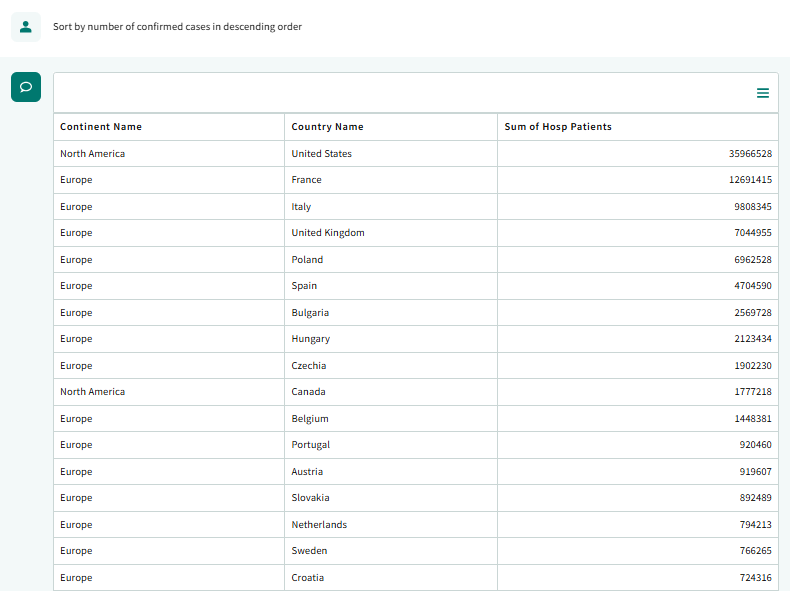
You can alter the order of the data returned by the query by simply requesting it. For example, you could request 'Sort by number of confirmed cases in descending order'.
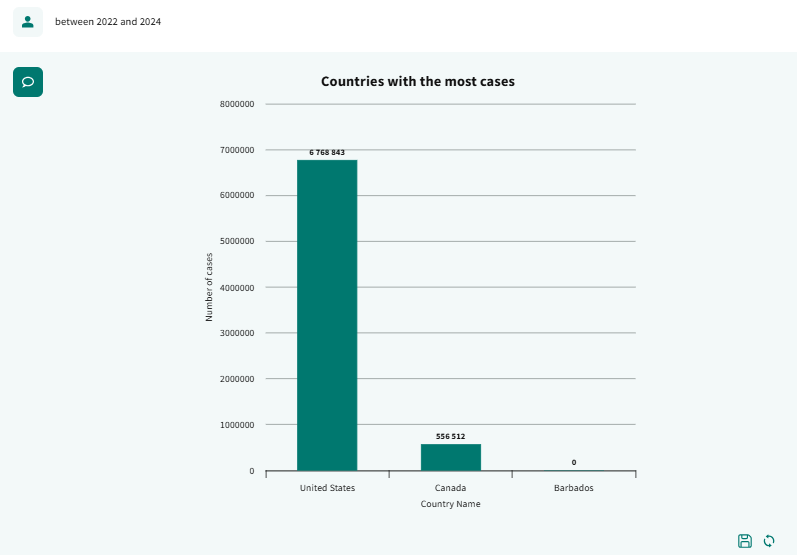
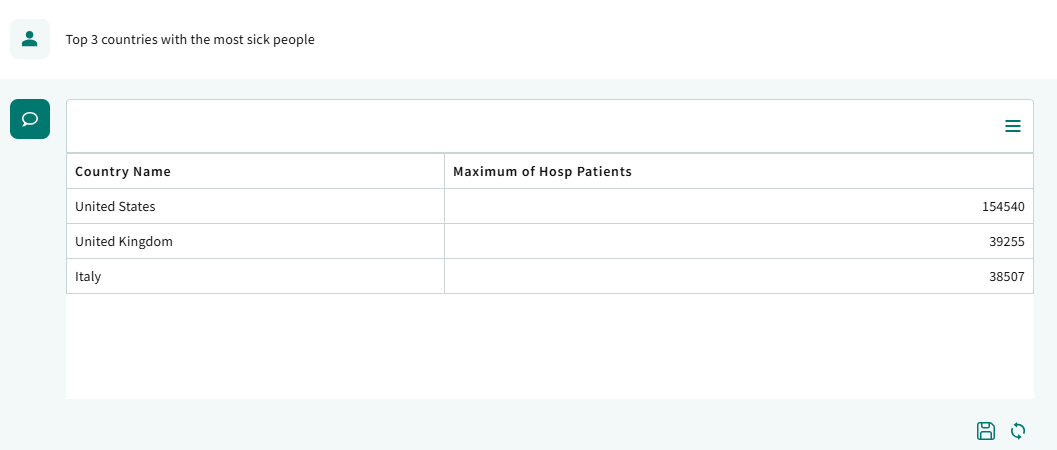
To generate a ranking and display the main results, you must request it in natural language. The assistant will sort the data in descending order according to the value you indicate and display the first X results. For example: 'Top 3 countries with the most sick people'.
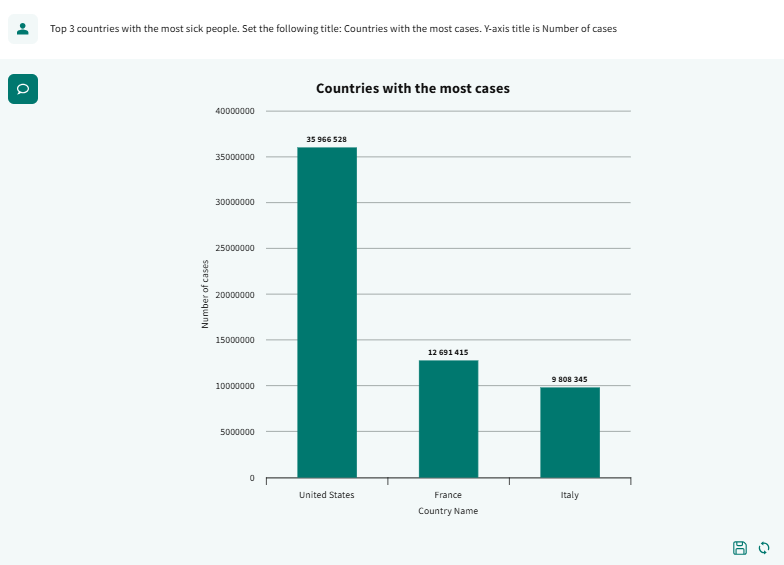
You can adjust several properties of the query according to your needs. For example, you can add a title by typing: 'Set the following title: Countries with the most cases'. You can also change the Y-axis title with the instruction: 'Y-axis title is Number of cases'. These actions allow you to customize further how the data is displayed.
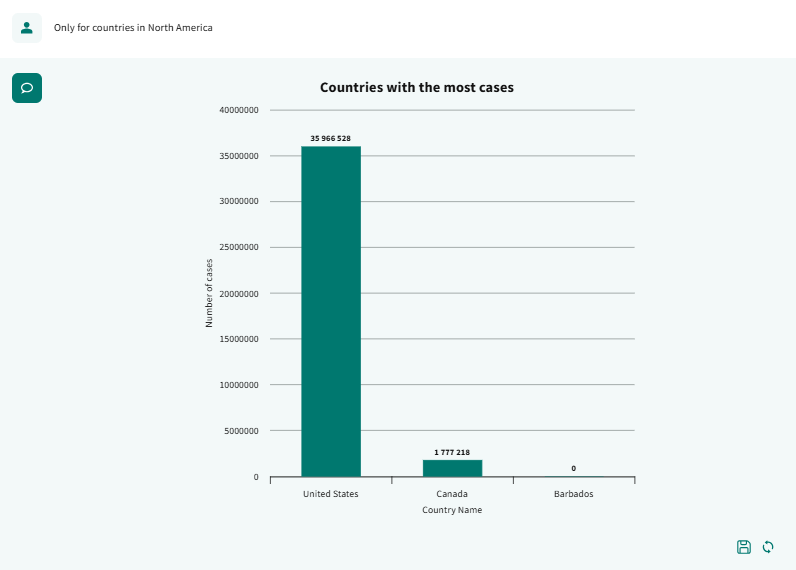
You can apply filters by referring to the field and value you want to consider. For example, if you have obtained a ranking of the countries with the most cases of a disease, you can apply the filter, 'Only for countries in North America'. This will refine your query and display the data specifically for that region.
You can also filter by date. For example, following the example of 'Only for countries in the Americas', you can use expressions such as 'between 2022 and 2024' to limit the range of dates you want to consider.