Deprecated: Since GeneXus X Evolution 3 Upgrade 3.
This article is a quick tutorial to learn how to use this control. It is often used to show high density series of values.
Follow these steps through the example to understand how this control works.
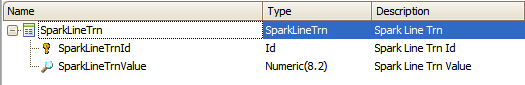
1. Create a Transaction object where you can save the data you want to show in your Spark Line Graph. In this case we created the following Transaction:
Also, we filled the Transactions with different values (30 registers approx.; you can fill it with the amount you want, this is just an example).
The next Procedure object was used to load the values.
New
    SparkLineTrnValue = 10.2
EndNew
New
    SparkLineTrnValue = 13.8
EndNew
New
    SparkLineTrnValue = 18.4
EndNew
New
    SparkLineTrnValue = 15.9
EndNew
New
    SparkLineTrnValue = 10.2
EndNew
New
    SparkLineTrnValue = 13.8
EndNew
New
    SparkLineTrnValue = 18.4
EndNew
New
    SparkLineTrnValue = 15.9
EndNew
New
    SparkLineTrnValue = 10.2
EndNew
New
    SparkLineTrnValue = 13.8
EndNew
New
    SparkLineTrnValue = 18.4
EndNew
Now that we have the information we need, we will show this info in a Spark Line Graph.
The SD SParkLine control consumes the information from an Structured Data Type (SDT).
2. Create an SDT with the following structure:
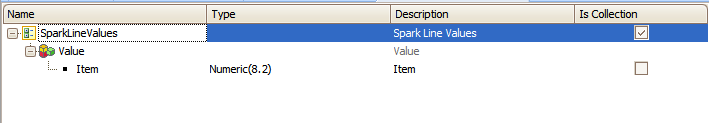
Or import the definition of this SDT (Xml) from the directory of your GX installation: "C:\GxwCardal\UserControls\SDSparkLine\SDSparkLine.xml".
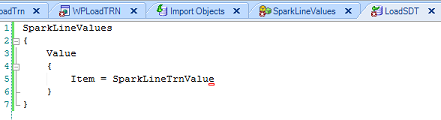
3. Define a procedure or data provider to load the SDT with the information of step 1.
For this example, a Data Provider object with the following code will work.
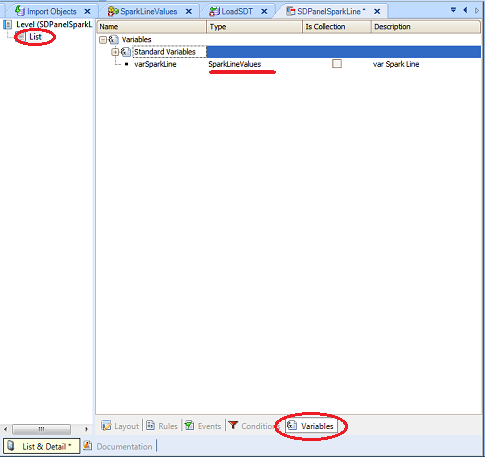
4. Create a new object Work With pattern and Work With object (WWSD) where you want the graph to be shown. On the List node create a variable based on the SparkLineValues SDT.
Drag and Drop this variable to the layout:
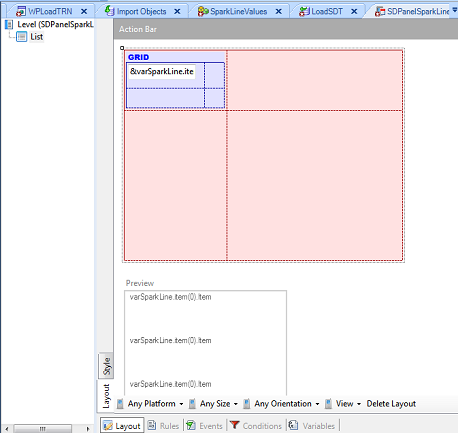
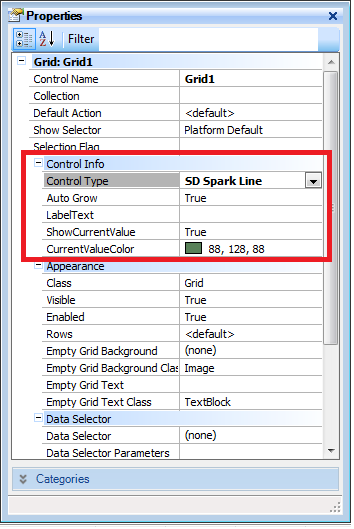
Set the following properties of the Grid control:
| Auto Grow |
If this property is true then the field will adjust the length of the attribute. |
| Label Text |
The text that will be shown as the label of the graph. |
| ShowCurrentValue |
A flag that indicates if the last value of the series will be shown. (The last value would be the current value). |
| CurrentColorValue |
The background color, border color, border width are taken from the theme definition. |
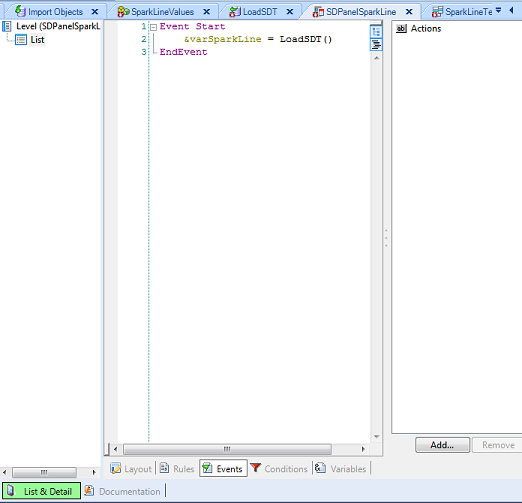
The final thing we need to do is to define a Start event in our Events tab of the WWSD. In that event, we have to load our variable with the Data Provider object we have just defined.
Done! You'll now have a cool way to show a series of numbers in a Smart Devices application:
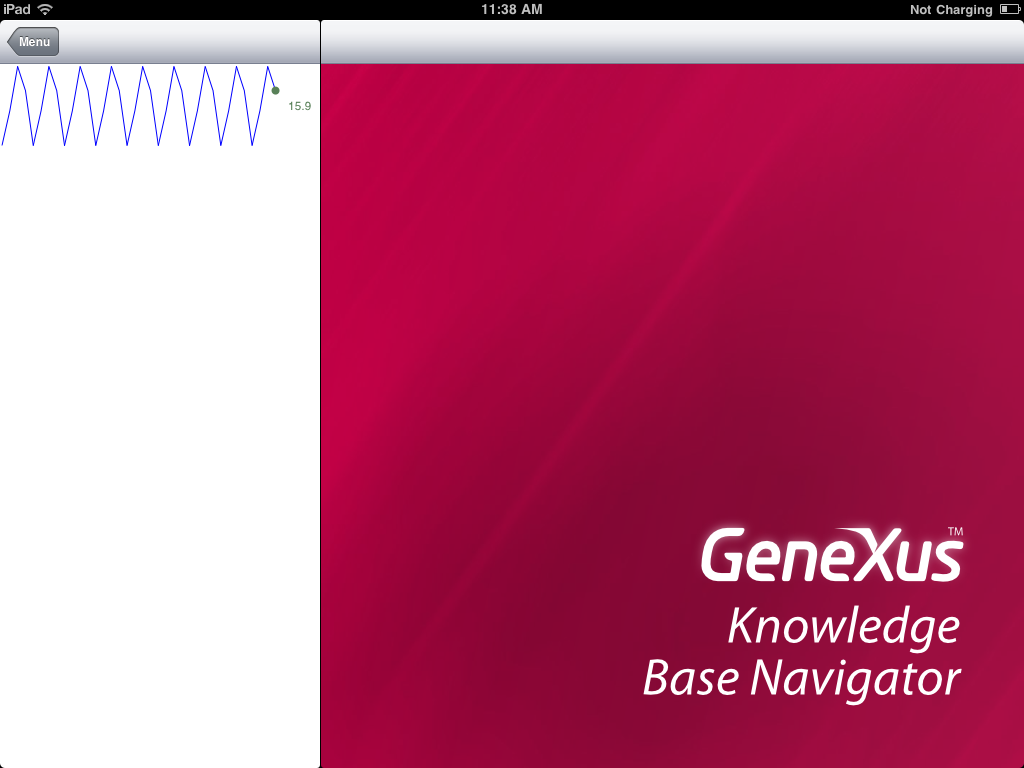
Sparkline control will draw the first numeric value found in the Grid for Smart Devices.
For BlackBerry not yet implemented.
 Work With for Smart Devices – General Aspects and List layout
WorkWith for Smart Devices – Detail Layout