Many times developers need to debug their SD Apps. Depending on the platform used, there are different ways to get logs and traces.
Android has a generic log which gathers information from every app executed on the OS. This log is constantly saving to the device information from all the apps and system services of the device.
A developer can obtain this log:
Note: This method only works in versions prior to Jelly Bean or rooted devices.
An app on Google Play Store named CatLog enables the user to view, filter, save and search all the information of the log directly on the device.
When executing CatLog on a device, you will see there are tons of messages that update very fast.
If the application is active it is automatically generating logs and you can search by the keywords "GeneXus" or "GeneXusApplication". Messages will be displayed. When you find one that you are sure is from your app, just long-tap on that line and the app prompts you with an option to filter the log for that process ID. There you'll have all the messages of your application.
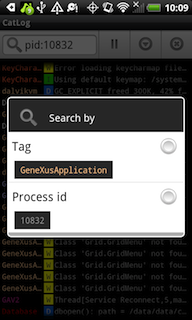
Result of LongTapping on a line.
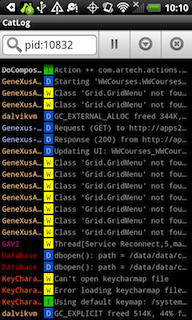
The log list after selecting the Process ID filter option.
It is important to know that for any of the following methods to work properly, the device drivers should be correctly installed on the computer.
To execute catlog on the computer, follow the steps below:
- Execute the following command <AndroidSDKDirectory>\platform-tools\adb logcat > log.txt
- Execute the KB from GeneXus.
- Whenever you want the logging to stop, press Ctrl+C on the command prompt window. The result will be a log.txt file with all the logs of what happened on the device in that time lapse.
Android SDK has incorporated a debug software named DDMS.
Execute the following file located at: <AndroidSDK>/tools/ddms.bat or <AndroidSDK>/tools/monitor.bat (it can take up to 1 min to start the program).
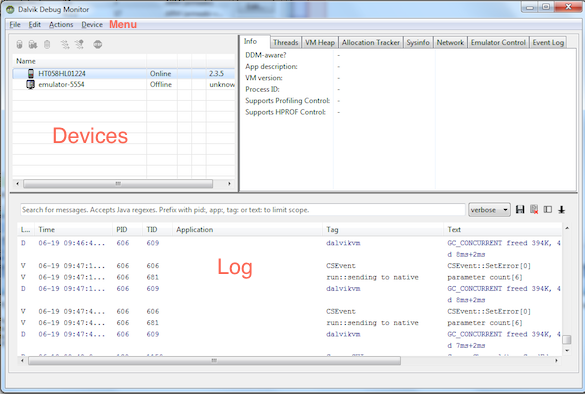
Main features of ddms:
- See the log of a device. Just select a device or emulator from the left pane and the output will start showing the log.
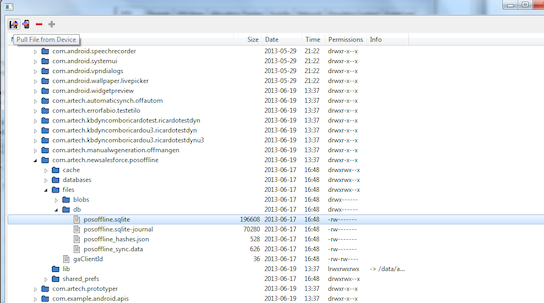
- Export files from the device to the computer. This can be done on the Menu option Device/ File Explorer.
This will open all the files the emulator or device has. (Some files on devices are not visible except on rooted devices).
To extract a file from the device/emulator, press the save button on selecting a file.
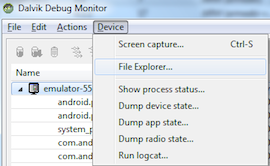
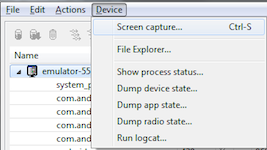
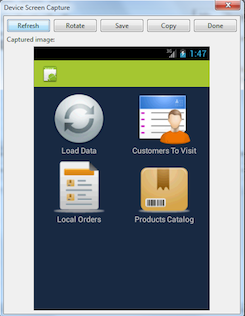
- Take snapshots of the emulator device. This can be done on the Menu option Device / Screen Capture.
Sometimes it is useful to see the interaction of the device with the server to check for errors and debug the rest services.
This can be done in iOS on the device or XCode.
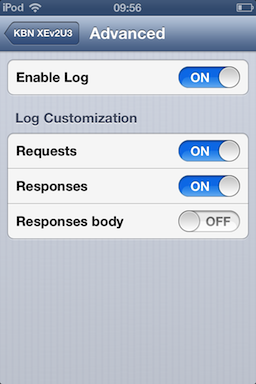
On the KBN the log is disabled by default so it is necessary to enable its Settings / Knowledge Base Navigator.
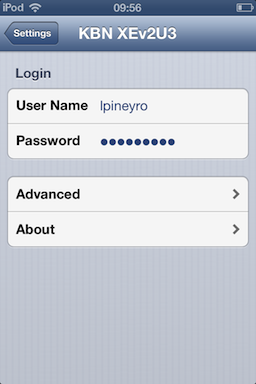
Once the log is enabled, executing the app is enough to start logging on the device.
To check the log, a new button will appear on the KBN.
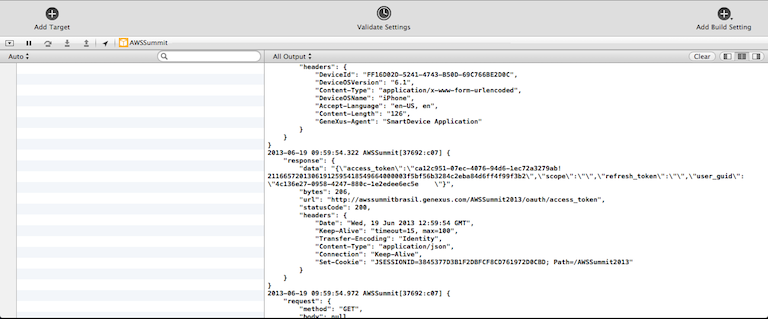
When using a Mac, enabling the debug area of the Xcode is enough to see the interaction between Device - Server.
To enable the Debug Area on Xcode, click on the top - right corner button:

Once this is done, execute the app in a simulator or iOS device connected to the Mac through XCode, and all the logging will appear in the debug area.
Take a look at How To: Get the crash log of a production iOS app.