This is part of the GXquery 4.0 Lab and should be done after Exercise 3.
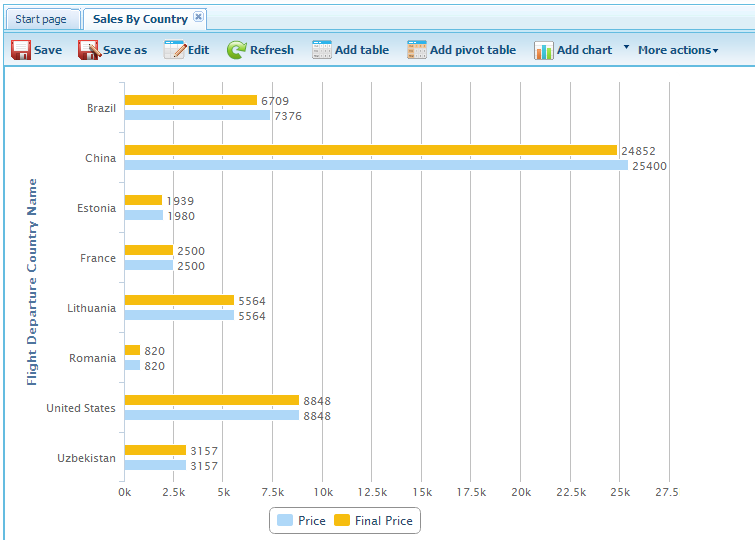
In this exercise we will create a graphic that shows flight ticket sales in money for each country. Tickets have two prices, standard and final, the latter resulting from applying a discount to the former. The result should be similar to the one shown in the figure below.
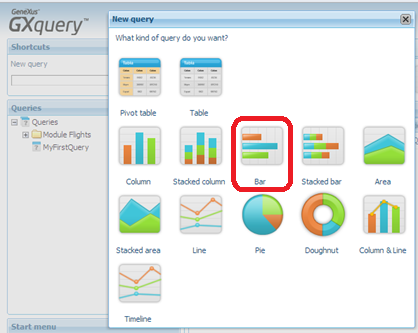
To create a Chart type graphic, click on the New query link on the Shortcuts panel (or on the New chart link if you are on the Start page tab), and then select the Bar icon.
Next, you will see the dialogue window you already know.
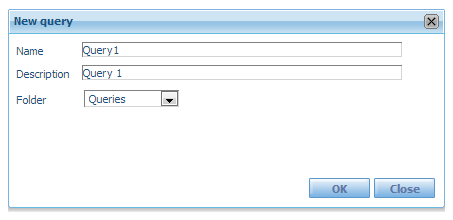
In the Name cell, write SalesPerCountry (without spaces) as the name of the query and press the OK button.
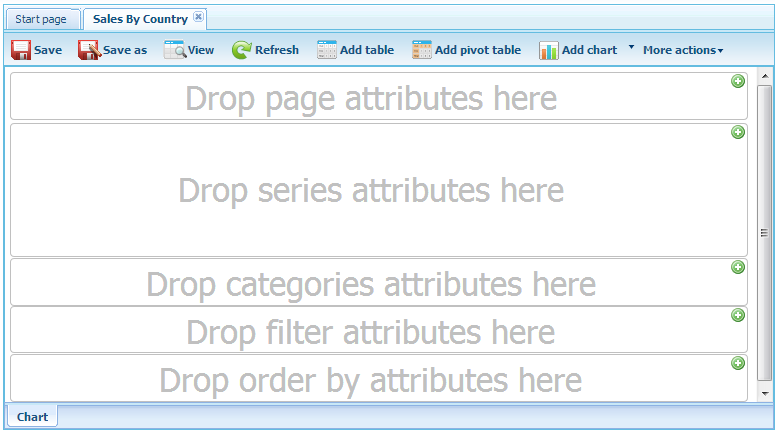
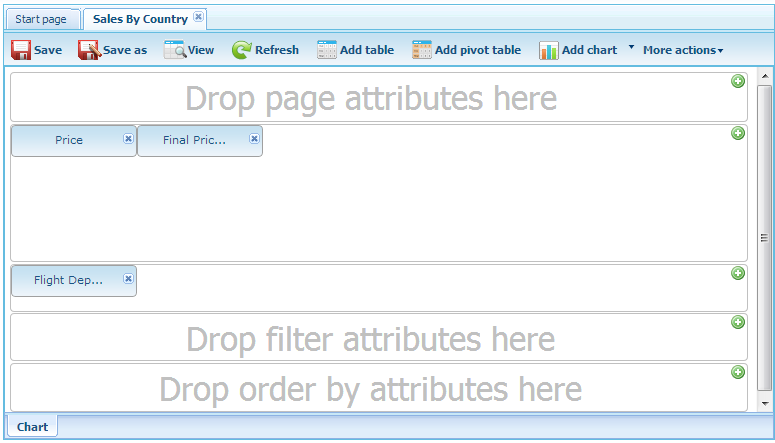
Next, you will see a screen divided into areas that contain labels. It is the Bar type Chart but in editing status.
1. Open the node of the Flight folder on the Attributes panel.
2. Drag and drop the Price and Final Price attributes in the series sector (it says “Drop series attributes here” inside).
3. Drag and drop the Flight Departure Country Name attribute in the categories area (it says “Drop categories attributes here”).
The image should be similar to the one below.
4. Click View to see what the graphic looks like.
Exercise 5
Before getting started
Exercise 1
Exercise 2
Exercise 3
Exercise 5