Team performance analysis in GXflow allows evaluating the performance of users based on the number of tasks completed within a given period. It helps assess individual user productivity, identify potential bottlenecks, and balance workloads within the team. By examining the performance of each team member, the analysis aids in understanding the overall team efficiency and recognizing areas for improvement. This module includes the following indicators:
Purpose:
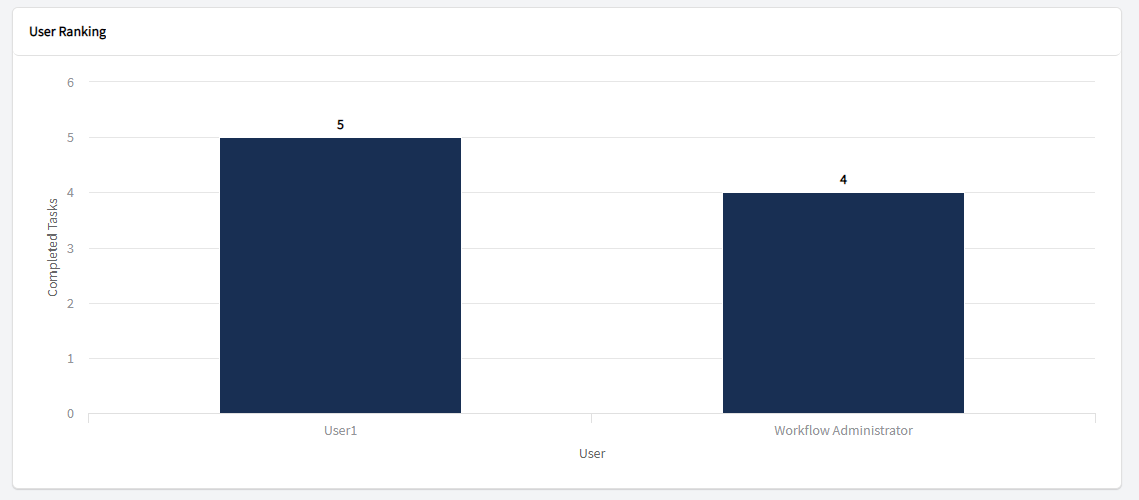
To compare the number of tasks completed by each user within a specific role, during a defined period, for a selected process and/or task.
Usefulness:
Helps identify which team members have a higher workload or productivity in task execution, useful for balancing work distribution, recognizing top performers, or detecting potential human bottlenecks.
Interpretation:
The chart shows that User1 completed 5 tasks, while Workflow Administrator completed 4.
Only users who completed at least one task during the selected period are included.
Filters allow analysis adjustment by role, process, task, or dates.
This provides a detailed view of individual performance for completed tasks, enabling comparisons.
Purpose:
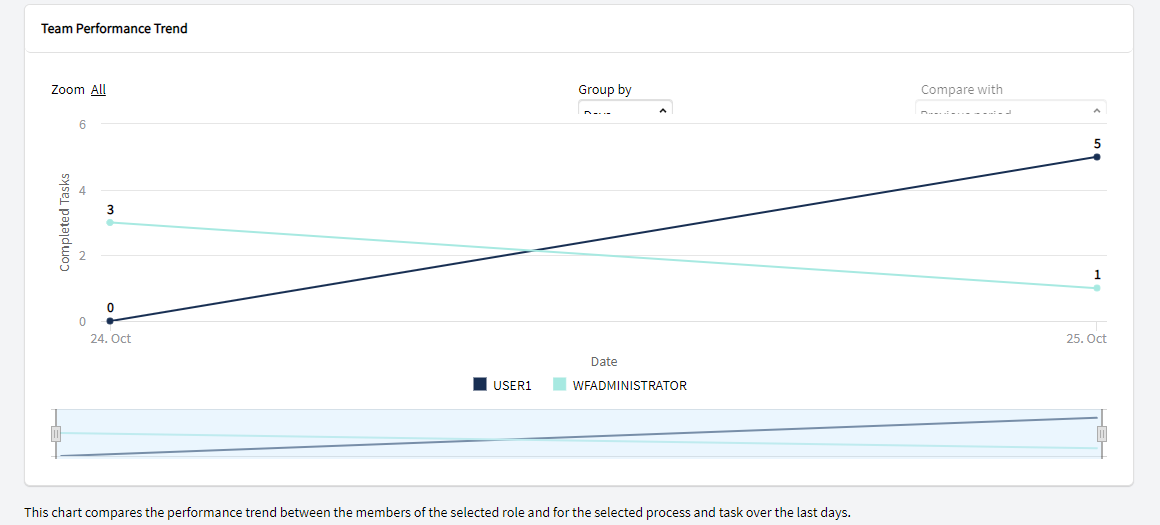
To analyze the temporal evolution of performance for users in the same role based on completed tasks.
Usefulness:
Allows visualization of performance trends over time, helping to identify workload patterns, productivity peaks, or potential decreases in task execution.
Interpretation:
User1 shows an upward curve in completed tasks, reaching a total of 5 by October 25.
WFAdministrator maintains a flat line, indicating a single completed task.
This suggests that User1 was the most active member during that period, while the other user had low participation.